If you publish a blog or niche site long enough, eventually you’ll lose some traffic. Early on, once a site starts growing, growth can be rapid and consistent. Eventually, though, your traffic might plateau and even drop. This could be out of the blue or the result of a Google algo update.
If you want to get to the bottom of this, you need to figure out which posts or articles lost traffic. Sometimes it might be one article that was getting tons of traffic no longer does. Other times it might be small loses sitewide. And yet other times it might be a combination.
Would you like to save this?
How do you find which posts lost traffic and how much traffic they lost?
It’s actually pretty easy in Google Analytics. Here are the steps:
Step 1: Filter for Google organic traffic
Typically you’ll want to filter for Google traffic only. If you’re concerned about another traffic source, filter for that source. Here’s how to filter for Google traffic:
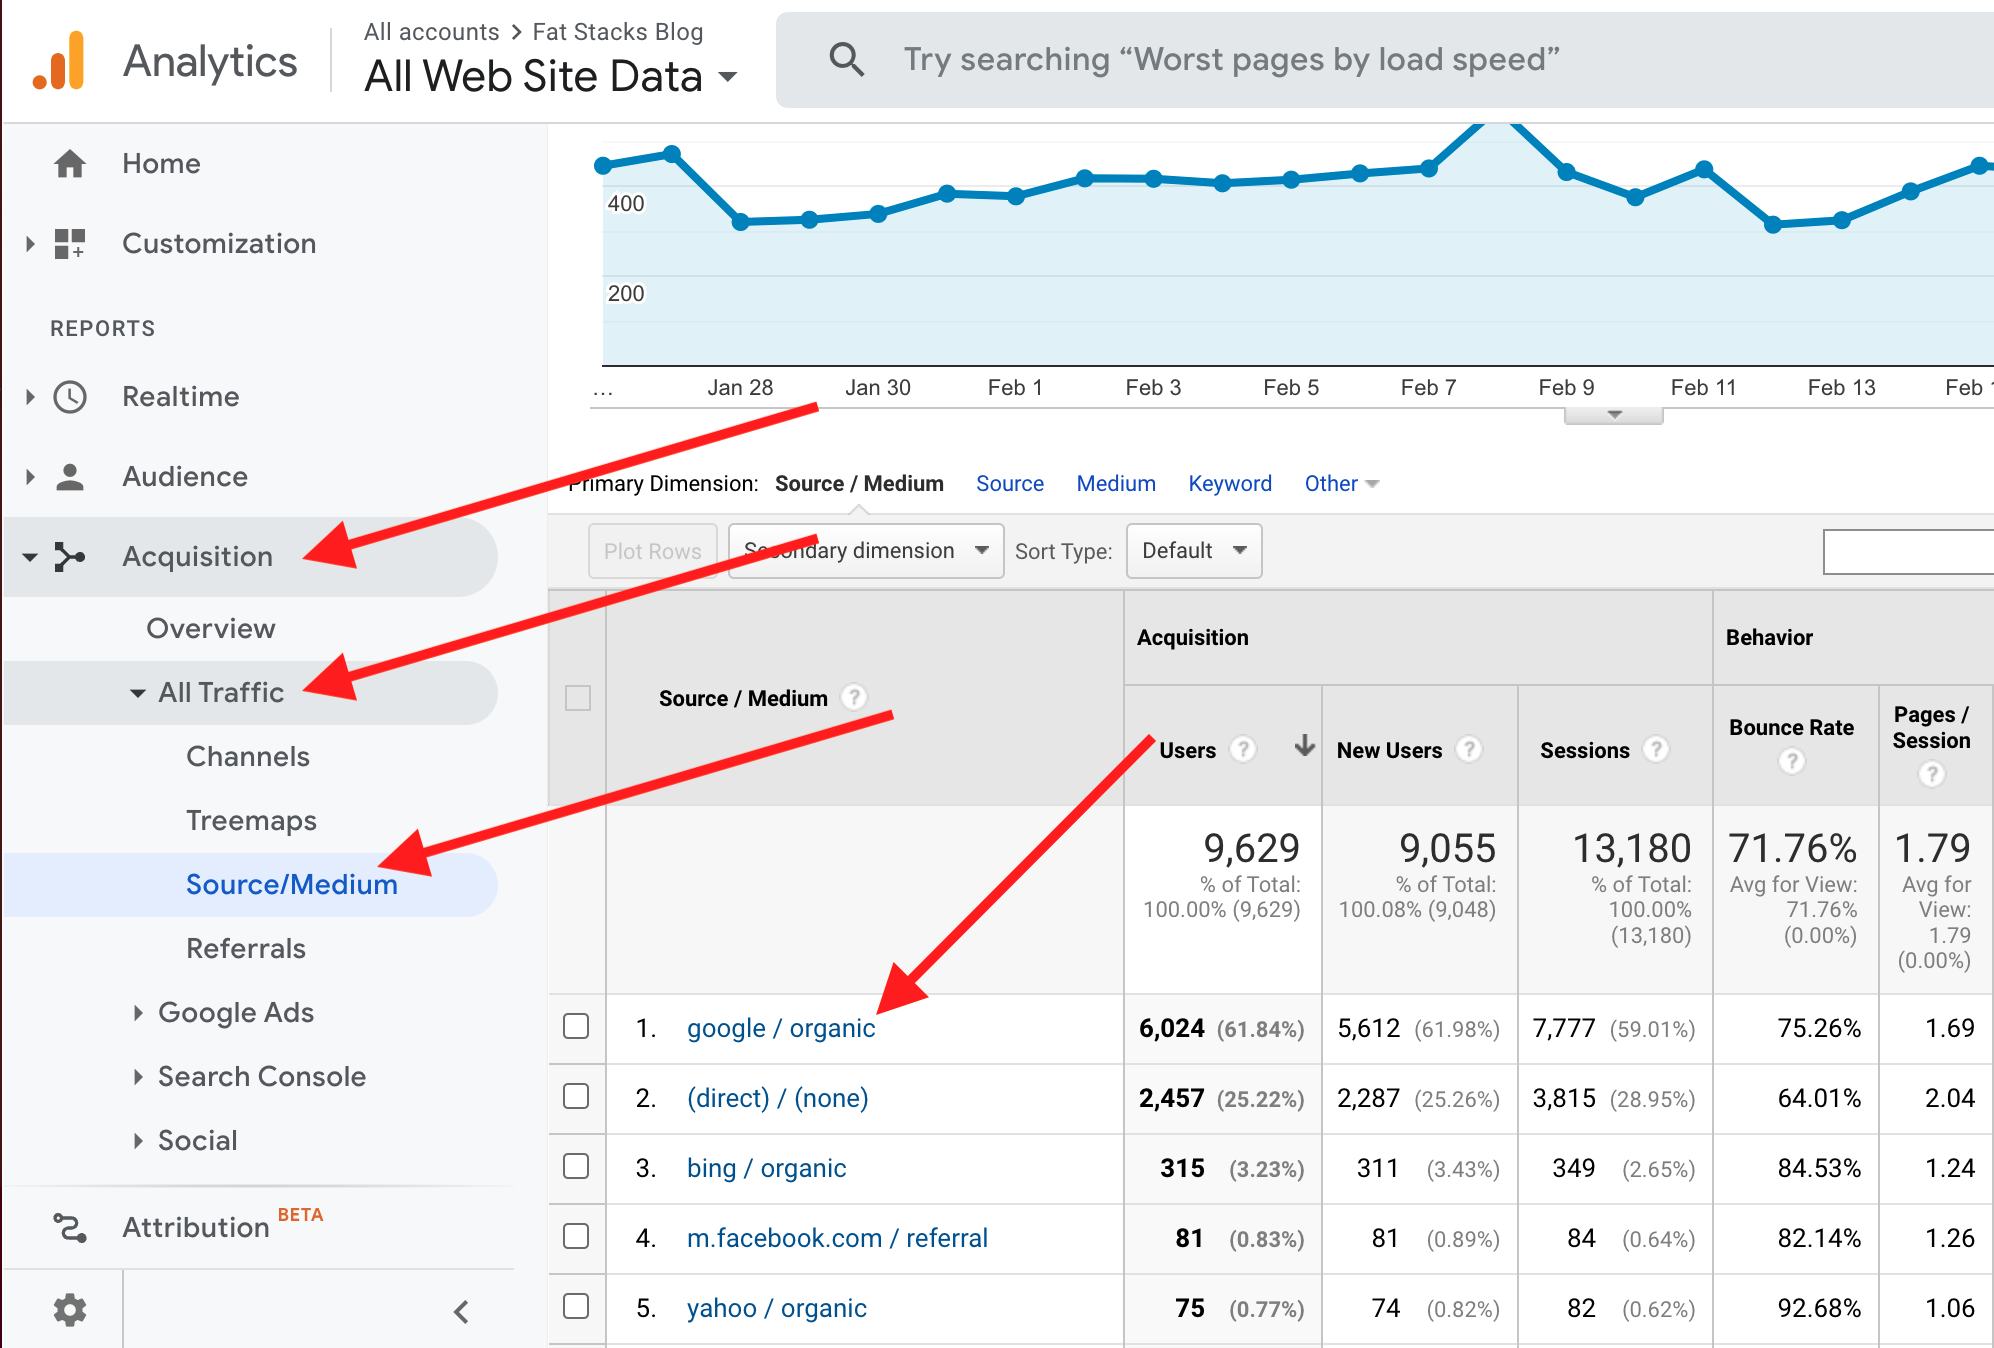
=> Acquisition
=> All Traffic => Source/Medium
=> Click into google/organic (or whatever traffic source you wish to assess).
Step 2: List out all pages/posts on your site
Next you want to list out all your pages/posts on your site.
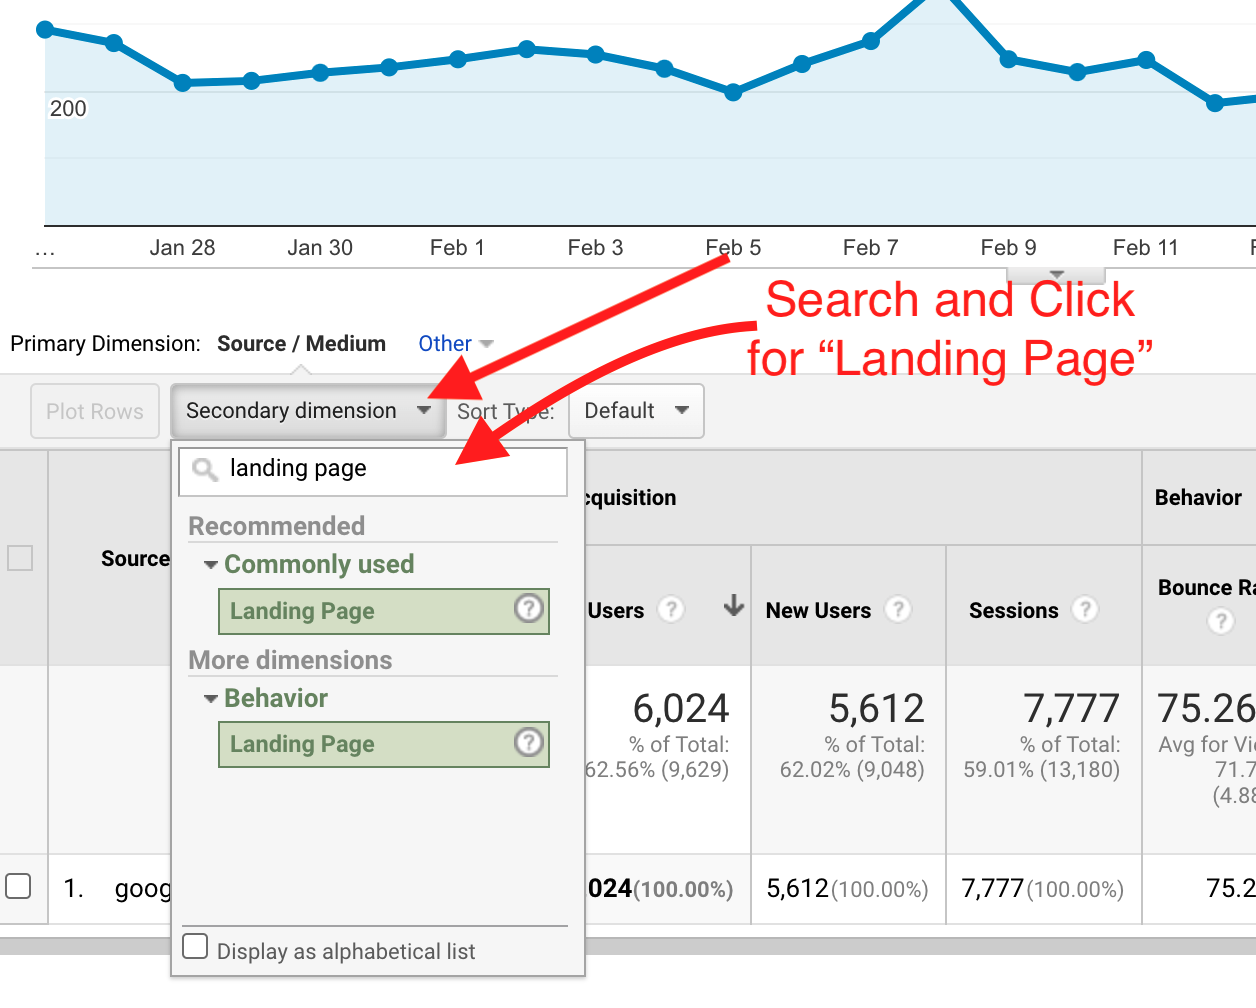
=> Drop down the “Secondary dimension” option.
=> Look for “Landing Page” and select it.
Step 3: Add rows that most closely matches the number of posts/pages on your site
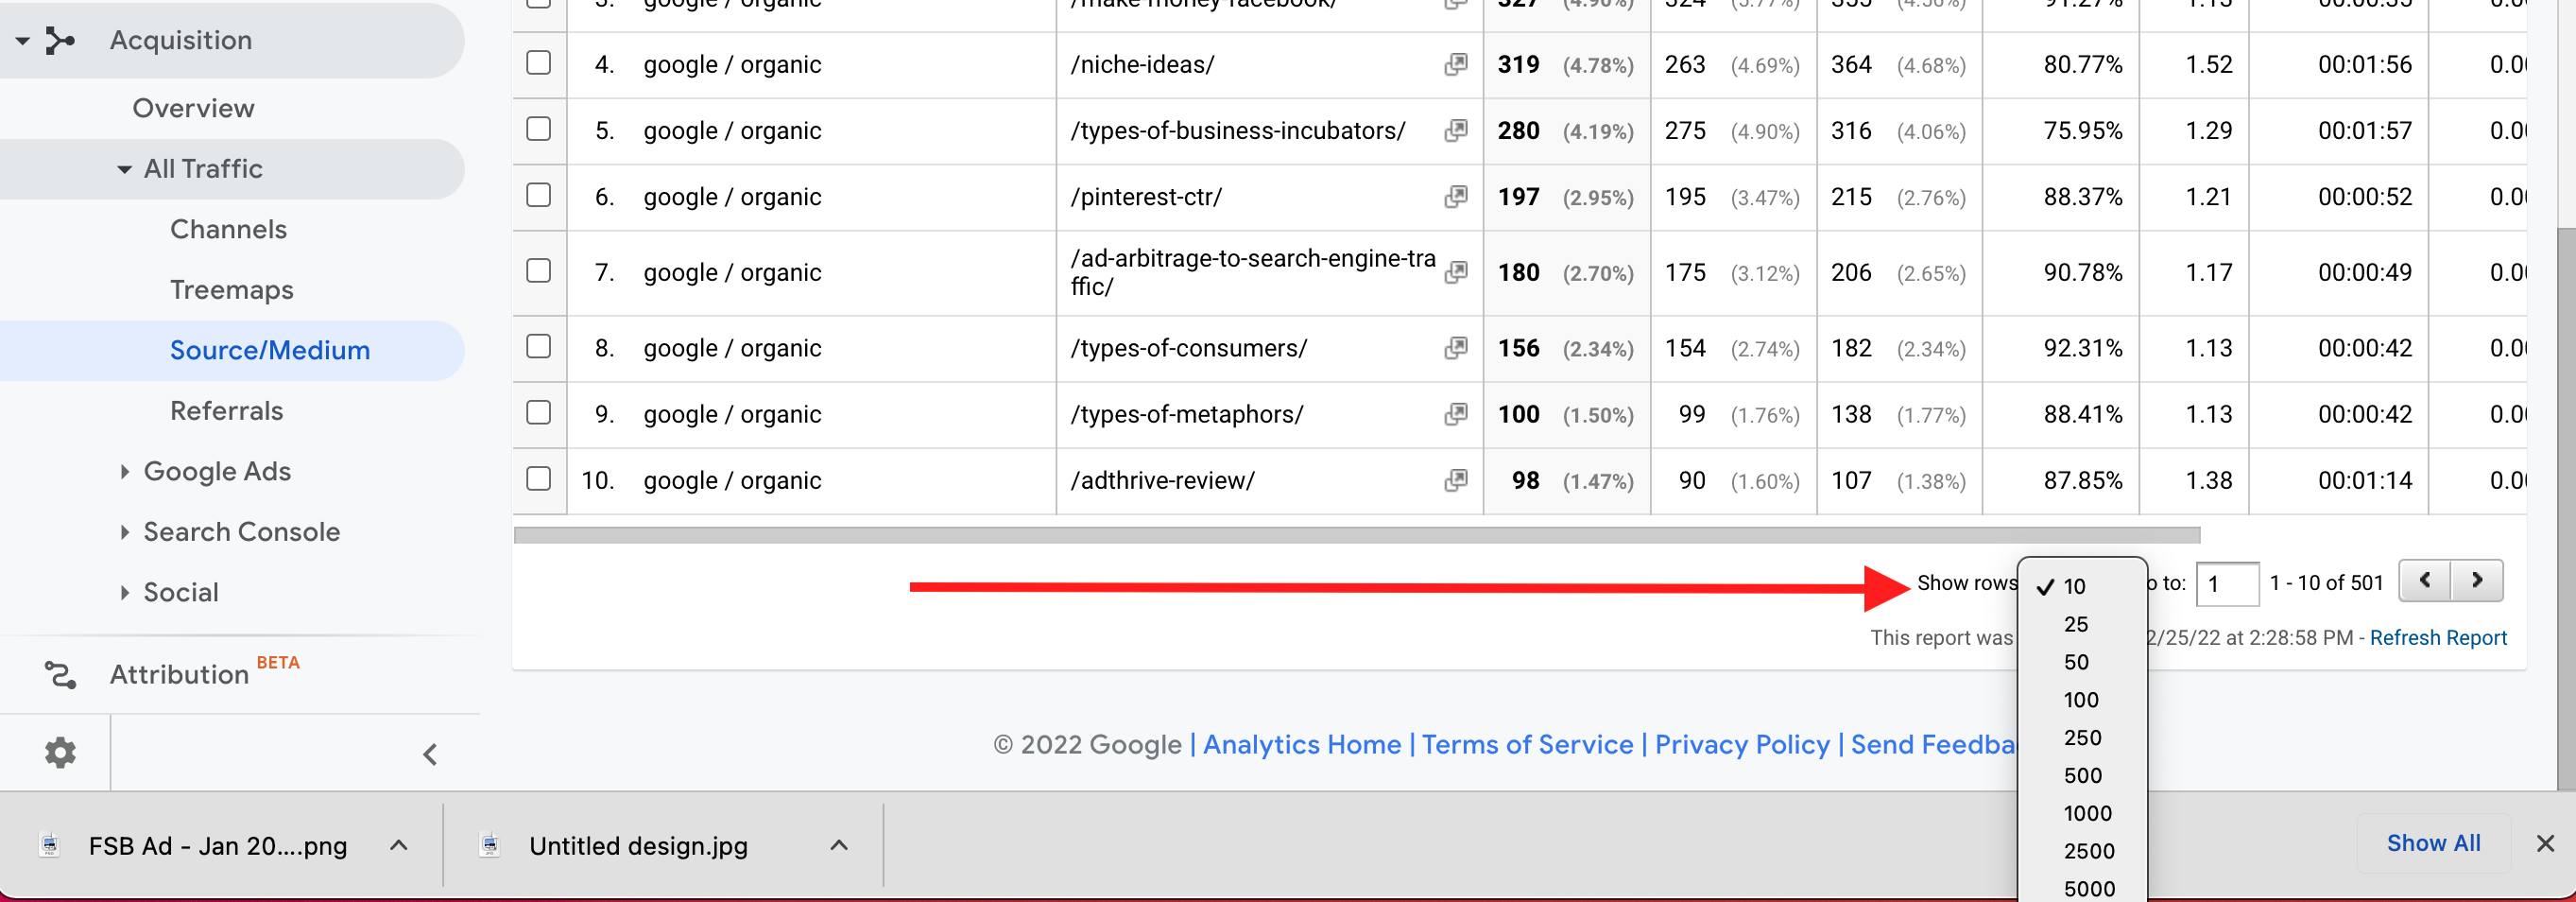
=> At bottom right, I like to show more rows… usually roughly the same amount of posts on my site.
Step 4: Set the date ranges you want to compare (top right of Analytics)
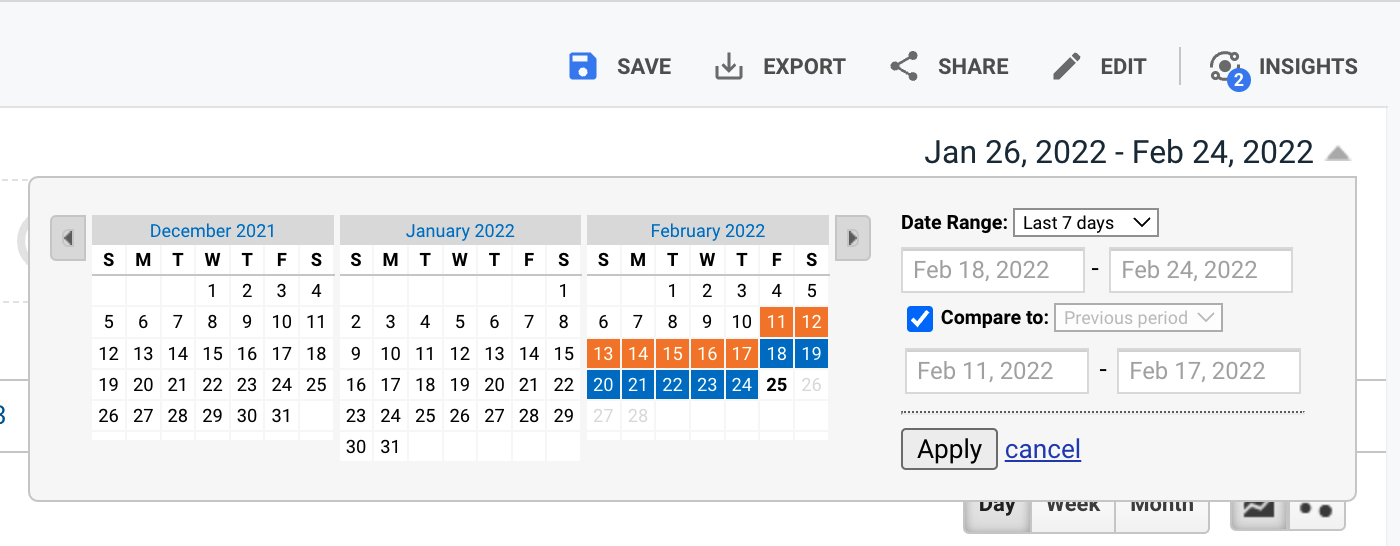
Next you have to select the two time periods to compare.
=> At the top right choose the first range.
=> Click the “Compare to:” box.
=> Input the second date range.
=> Click “Apply”
Tip: Make sure the number of days or days of the week match so that you’re comparing apples to orange. For example, you don’t want compare Mon and Tue of one week with Sat and Sunday of another week because traffic varies throughout the week. Unless, of course, you want to see the traffic differences among those days. In that case it’s a valid comparison.
Step 5: Comb through the data checking which posts lost traffic and by how much
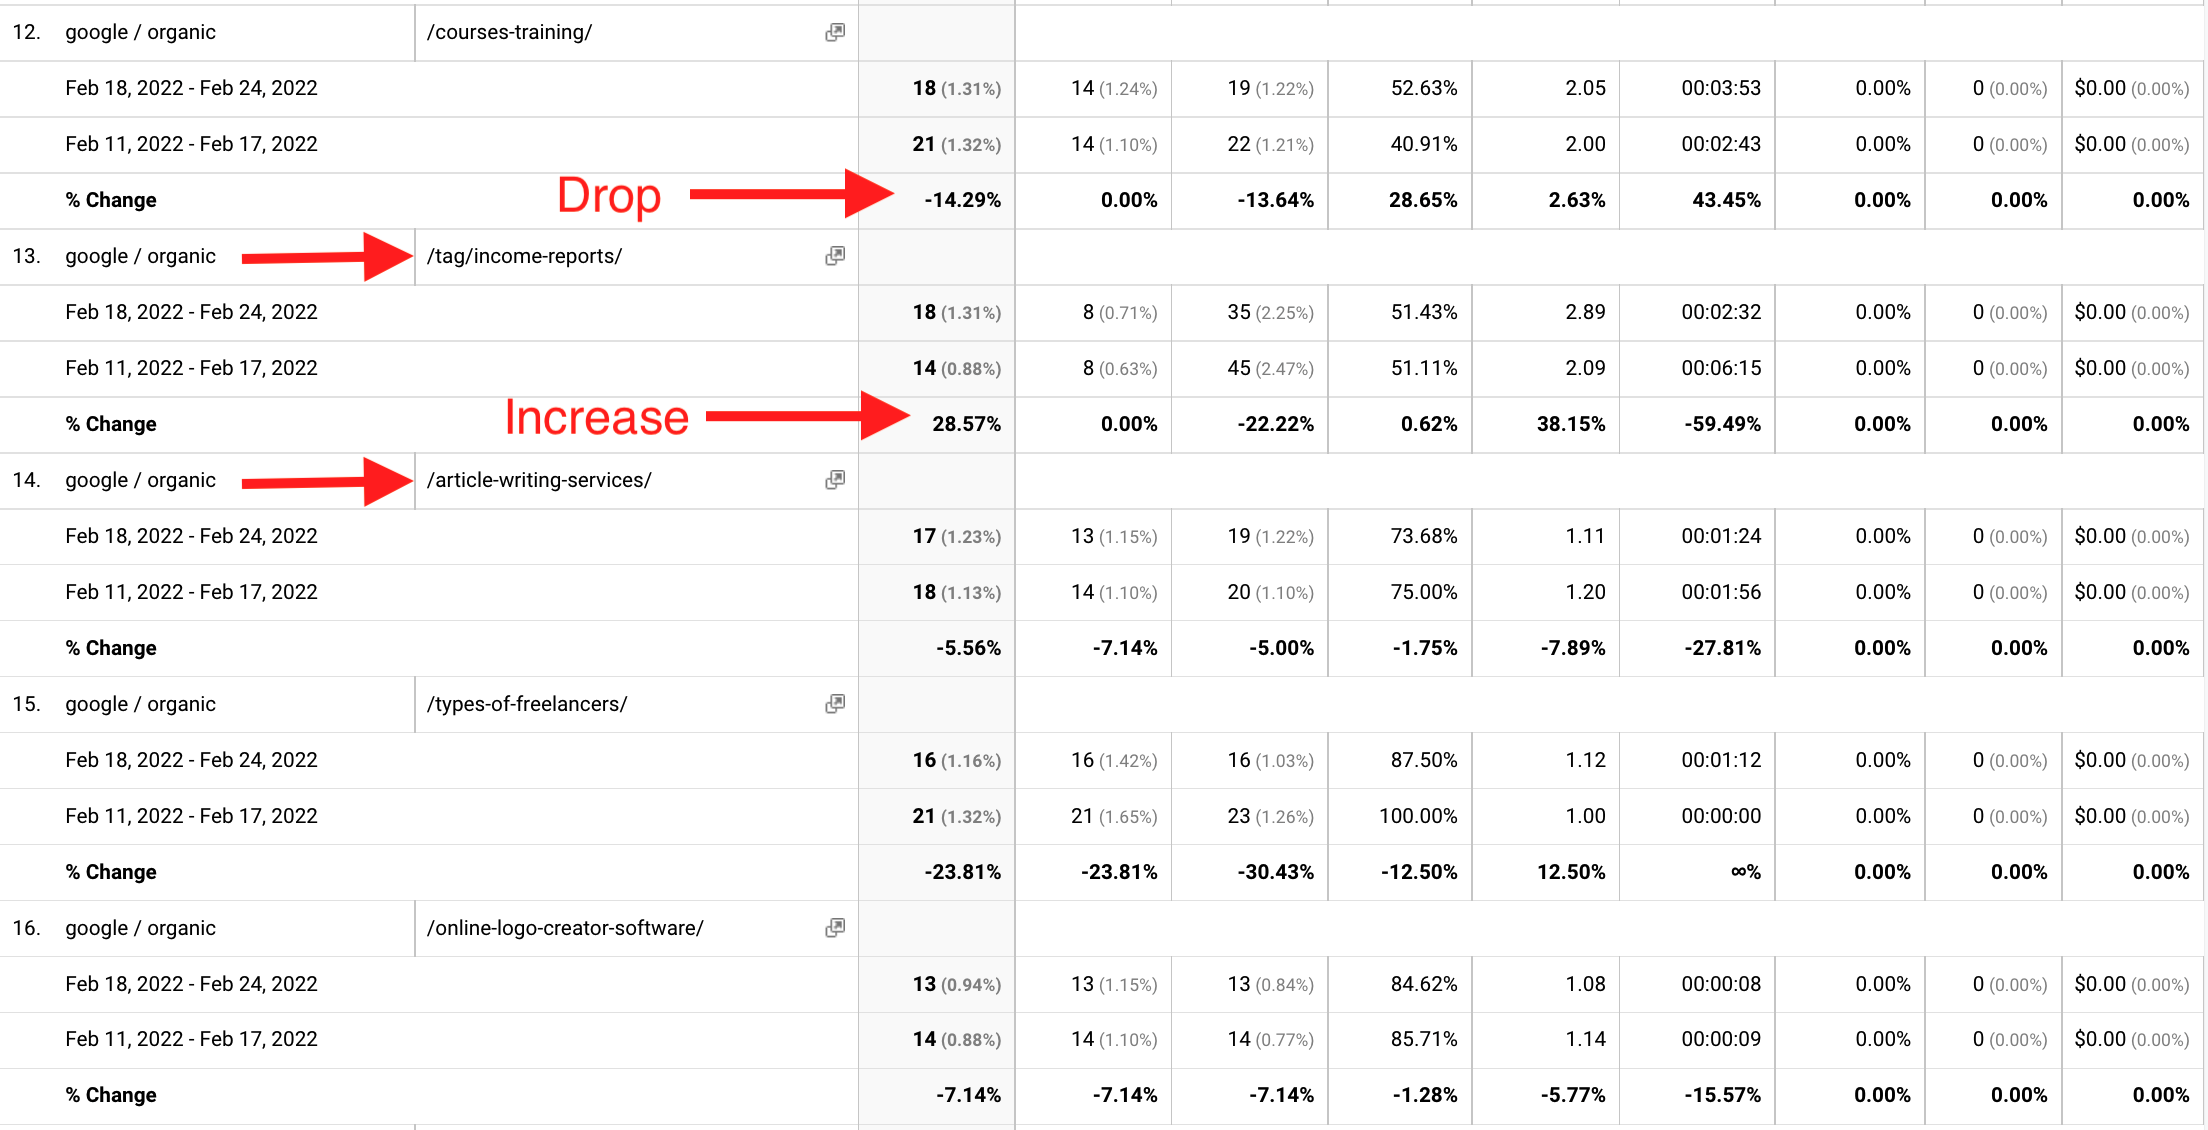
Scroll down and you’ll see all your site’s URLs along with whether organic traffic increased, decreased or stayed roughly the same for the two date ranges. This is a very helpful screen to figure out what’s going on whether traffic is growing or decreasing.

Jon Dykstra is a six figure niche site creator with 10+ years of experience. His willingness to openly share his wins and losses in the email newsletter he publishes has made him a go-to source of guidance and motivation for many. His popular “Niche site profits” course has helped thousands follow his footsteps in creating simple niche sites that earn big.