
Jon here… this is a write-up provided by Designcap. Designcap offers a way to create great-looking infographics, charts, etc. for free. Because I like using such graphics in content, I agreed to publish their submission. As you’ll see, it’s self-serving but it is free and you can create some cool stuff with it. I was not paid to publish this nor are the links to Designcap.com affiliate links. It’s just a good freemium software I wanted to feature for readers.
Here it is…
Would you like to save this?
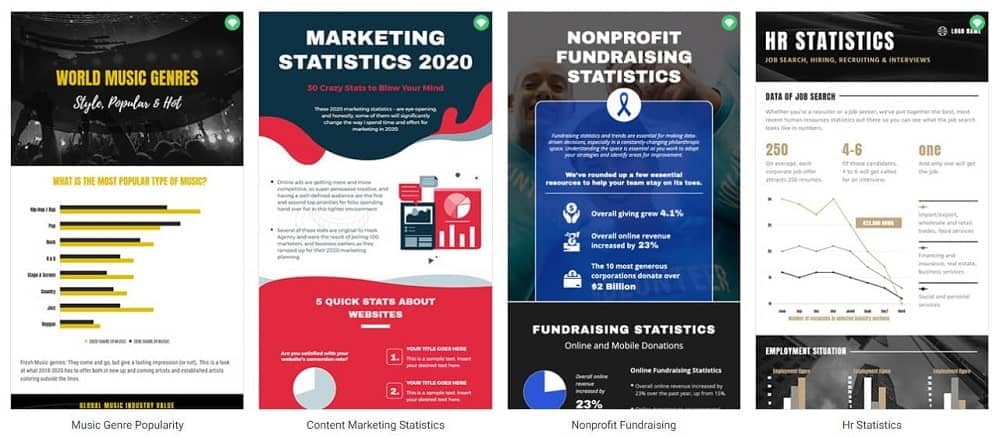
Creating an infographic has become a highly illustrative resource that summarizes the information that you want to convey in a certain way. The intention is to energize the information by promoting teaching resources in classrooms for exhibitions. In companies to notify their annual reports. In written media such as the press, especially related to the internet.
In marketing, in general, the use of this resource is considered valuable and attractive. It attracts the reader because it is didactic. From a scientific point of view, its great attribute is that an infographic is capable of simultaneously activating both hemispheres of the brain. Recommended activity since, in this way, you exercise your brain gaining quality of life.
What is an infographic?
According to definitions found when searching online, an infographic is a “visual representation of information or data.”
But what its real means is something much more specific. An infographic is the union of images, graphics, and as little text as possible to offer a more simplified view of a given topic. Infographics use an attractive layout to convey information quickly and clearly, without creating confusion.
Infographics can be simple, but the more creative they are, the more visually unique, the more effective they are because they attract more people’s attention and don’t let them go without first taking a “peek.”
Despite this, it is crucial to remember that the layout of an infographic must go beyond engaging readers; they must help them understand and remember content.
People are increasingly aware of how interesting it is to absorb content from an infographic and companies, which already invest in this model, have achieved better visibility within their respective market, of course.
Do you want to make one of your posts viral and get dozens of links and mentions? So you need to create an infographic, and I’m going to help you do it with DesignCap Infographic Maker in less than 5 minutes.
Is it easy to create an infographic using DesignCap?
Nowadays, making an infographic is much easier than when technological advances did not exist. Even though they still exist, the ways of making them have been perfected so much that a wide variety of online programs are available on the market, which makes it easy for you to do them at any time. One of them is DesignCap, a graphic design tools website that simplifies design processes to a minimum.
In fact, this tool is used frequently by people who are not professionals, but this new application can give you surprising results—nothing to envy a professional. Below, we put together a step by step to make a perfect infographic using this online software.
Steps to create an infographic using DesignCap
Before starting your infographic design, you’d better sign up for DesignCap. To meet this requirement, you just have to provide your email account and fill in the required fields where required. It allows you to quickly access the application with a Google or Facebook account as well.
Once this requirement is fulfilled, you will have access to the program interface. The first impression that you can realize is: it is pleasant, colorful, and effortless to use. No editing experience required, just common sense, and right color combinations are enough here.
1. Choose an infographic template

Press the “Get Started Now” button located at the top left of DesignCap’s homepage. An options tab will immediately appear. Choose, in this case, “Infographics.” It’s OK to start a design from a blank template.
Browsing them, you will pick one to your liking finally. There are many other templates like presentations, reports, invitations, resumes, chars, YouTube thumbnails, Pinterest graphics, Facebook Covers, etc. Actually, you can use them to make a design for your blog post or blog banner to attract more readers.
2. Give a personal touch to your design
Before giving a personal touch to your design, familiarize yourself with the editor tools in DesignCap. After choosing your template, a new window will appear. On the left part of your screen, you will find the toolbar, including the options of templates, elements, photos, charts, uploads, text, modules, and background. I’m going to play with them one by one.
Add elements

You can include elements in the composition in the infographic design, making your blog post even more attractive, personalized, and exclusive. The program has a number of preset lines, stickers, masks, badges, and more in the elements tab that you can use.
It offers millions of online icons as well. Typing your keyword into the search box and pressing enter key, you will get different results. Click the one you love and use it in your design. Then you can change its color, size, opacity, position, etc. at will.
Enhance photos

DesignCap provides users more than a million stock photos, which are entirely free of charge. Like searching for icons, you are able to search for an image in the app.
The tool has numerous enhancement features to make your image professional. You can adjust the sharpness to give more life, increase or decrease the saturation, adjust the brightness and contrast, in short, make various adjustments and also follow the improvements in the layout screen in real-time.
It also allows you to upload images such as your company logo, brand, or rewriting on personal photographs and storing it in its interface. So when you need these images, they are always available on the cloud under your account.
Display data in a chart
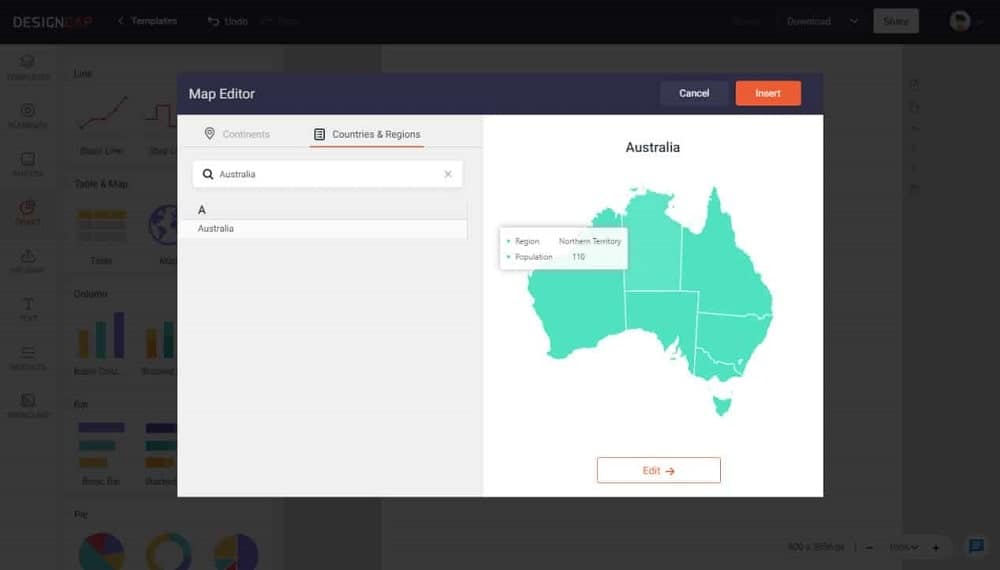
When it comes to creating an infographic with many data using DesignCap, my experience has been excellent. When I insert a map of, for example, “Australia,” I search the country name and get it quickly. Then it’s easy to make changes to the map color and values by clicking the “Edit” button below the map.

To make the map looks more beautiful, I set the map color, border width, and color. If you want to highlight any data, set it with a distinctive color. I set the color of “Queensland” to the red to emphasize this data.
DesignCap gives us more options to add other types of charts such as bar chart, pie chart, line chart, area chart, etc. What’s the best is that DesignCap allows us to import data from a spreadsheet of XLS, XLSX, or CSV. It’s brilliant and convenient if we have a large number of data that want to add to the design.

Once everything is imported, you can adjust the chart title, text font, the values of axis X or axis Y, and more.
Replace text
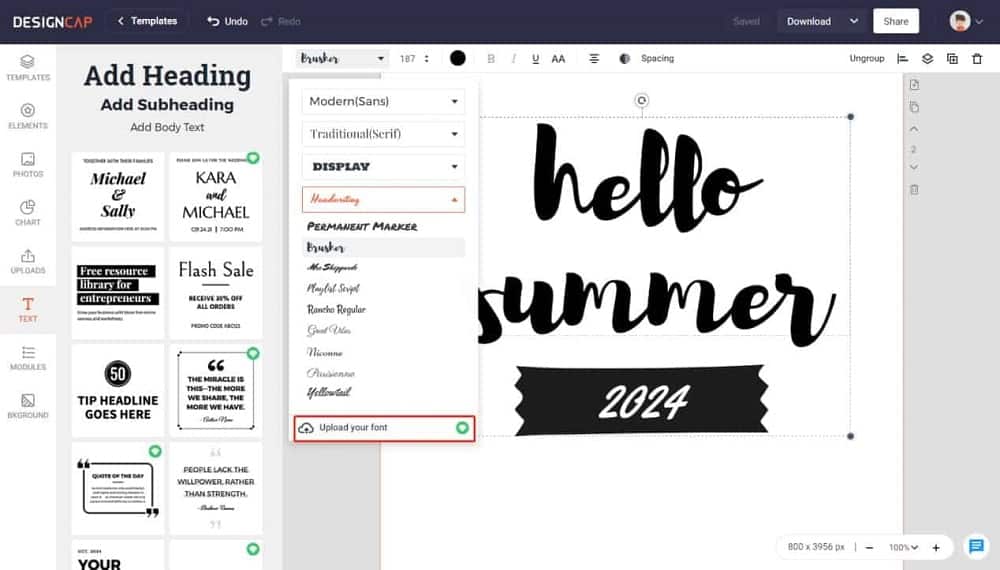
I love the resources of the pre-designed template, and I will substitute fonts and combinations in the same way. You can also choose text styles to apply to your infographic at the left side menu of the interface. There are a lot of different text formats to use in documents.
If you don’t want to use the preset ones, manually customize the text with options like size, font, color alignment, spacing, and more at the top of the canvas when you select a text object. Uploading your own font is also available in DesignCap, which can be found under the font list.
Use modules

This section aims to help people assemble images, graphics, and text delightfully and quickly. There are many pre-designed options like the social icon, icons&text, images&text, options, steps, diagrams, timelines and etc.
You can make custom combinations and placement of vectors, icons, and other elements. It offers the group feature in its toolbar. In this regard, the free version is the only one I know, and I can say that it is a complete tool. I highly recommend it to all people who want to start a career in digital design.
Set a background
It’s flexible to set a custom image as background by dragging the image and resize it to the same size as the canvas. Then adjust its opacity and layer to set it as your design background. Besides, DesignCap allows you to set a color background and use a preset pattern as a background too.
Download and share
If you handle other more advanced design programs, DesinCap has no problem with compatibility. You can save your design in JPG, PNG, or PDF format without any problem.
You can find the share option alongside the Download button. DesignCap gives users the option to share infographics anywhere they want with a URL generated by the tool.
Advantages of creating an infographic using DesinCap
Obviously, it is an indispensable tool in the digital world due to the large number of benefits it offers, let’s see:
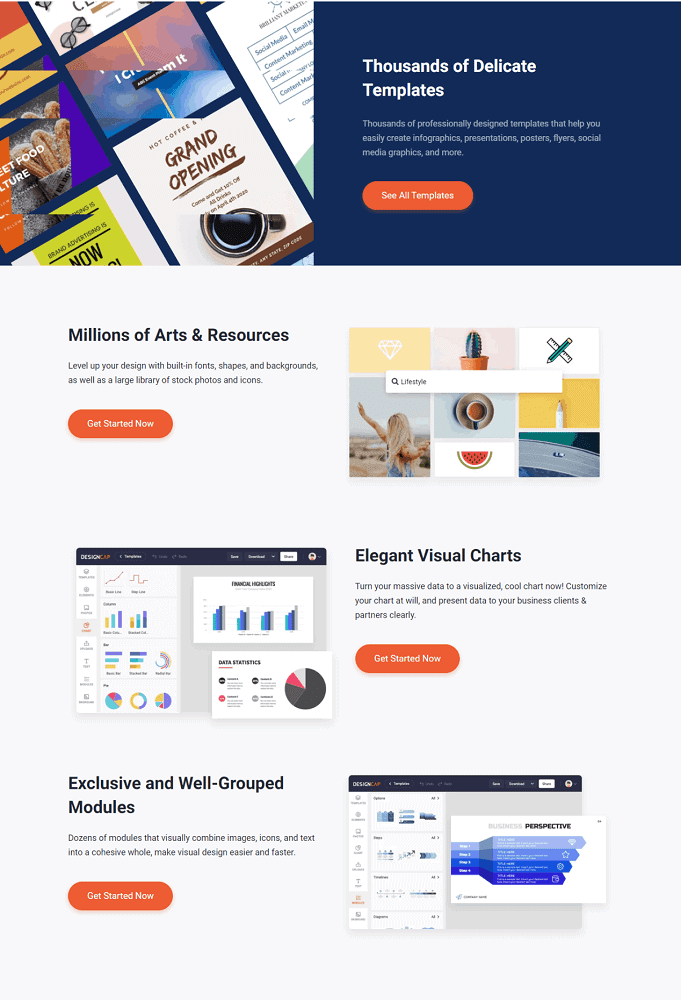
- It has a bank of photographic images with excellent quality that exceeds a million options. Likewise, it offers vectors, graphics, and fonts in a smaller proportion. In which you can use and combine the ones you like the most.
- You can share your creations directly on social networks.
- The templates are tailored to each social network, both for covers and publications.
- You can download the images in different formats, JPG, which is a format for small file size. PNG for high-quality images. Standard PDF and PDF for printing.
- You can save your creation to the cloud and work with it later. This option allows you to make pertinent changes upon an invitation made via email.
- It offers thousands of professionally designed templates for different topics.
- You can add data to the chart intelligently by importing data from a spreadsheet or manually adding them.
- With the straightforward interface, anyone can master it fully.
- It’s online without downloading and installing anything on your computer.
Disadvantages of creating an infographic using DesinCap
One of the main weaknesses of this tool is that it only works over the internet. So if the Internet service is intermittent or very slow, you run the risk that your creations will not load correctly, which is a bit desperate.
What others can DesignCap do?
Besides infographics, you can do more with DesignCap. These include presentations, charts, reports, resumes, schedules, logos, business cards, YouTube banners, YouTube thumbnails, Facebook covers, Pinterest graphics, ad banners, blog banners, etc. Unleashing your creativity, you can do more.
My opinion
In my opinion, DesignCap is an ideal tool to start the design journey. With DesignCap, you can understand the importance of combinations, the image in any post, the perfect font. I particularly use this tool on a daily basis and try to alternate it with other more advanced image editors. The results have been excellent to the point that I have been able to carry out any design task with a professional touch.
DesignCap is one of the complete programs with the most resources for creating pages and layouts, and the best of all is that this tool is free and works directly on the web, no need to install it on your computer.
To use the app, all you need to do is register by email or allow a connection via a Google account or Facebook – but don’t worry, DesignCap doesn’t publish anything on your behalf.
The program brings a great variety of resources for you to create pages, invitations, cards, and images to publish as you wish. The number of free figures and elements, all of the excellent quality, is impressive; there are all kinds of lines, shapes, masks, icons, as well as representations of people, animals, and vehicles to apply to your documents.
All these figures are identified when they are free, and you can still edit their settings, like size, color, or dimension, as you prefer. The workspace in DesignCap is also extremely easy to use, with quick identification of the elements and resources available.
The possibilities of creation within the program are unlimited, and you can create the most different documents and projects with your tools.

Jon Dykstra is a six figure niche site creator with 10+ years of experience. His willingness to openly share his wins and losses in the email newsletter he publishes has made him a go-to source of guidance and motivation for many. His popular “Niche site profits” course has helped thousands follow his footsteps in creating simple niche sites that earn big.


Great information. Thanks for sharing this great post