Dealing with numbers can be hectic, especially if you are dealing with a large amount of data. What’s worse, if you are required to organize the data and capture the trends, it can only be a chilling mirage.
However, there are numerous graphs and charts that you can rely on to help visualize the data. But their numbers pose a problem as you have to understand which chart type best fits what situation.
This article aims to help you choose the best fit for your scenario as charts don’t have one-fits-all applications.
Would you like to save this?
What is a Graph?
It is a pictorial organization and visualization of data to help you understand patterns and trends. Graphs and charts help you easily understand the connection between varying data sets. They are used to show trends, patterns, and the relationship between sets of data.
Remember that a graph may be practical to display certain data, while charts are ideal for others. The use of charts and graphs depends on what you want users to learn and understand from your collected data.
Difference Between Graphs and Charts
Most of the time, they are used interchangeably, but it is important to know the difference between them. Although we can say that graphs are charts and charts are graphs.
Graphs are mathematical diagrams that show the relationship between two or more sets of numerical data over some time. Raw data is represented through lines and curves, and the basic data has two dimensions.
On the other hand, charts represent datasets to make users understand information better.
Types of Graphs and Charts
Graphs vary in structure, shape, and color application. These colors and shapes in a graph give a different meaning that helps interpret the graph. Below is a list containing the different types of charts and graphs, their strengths and weaknesses, and where to use them.
Line Graph

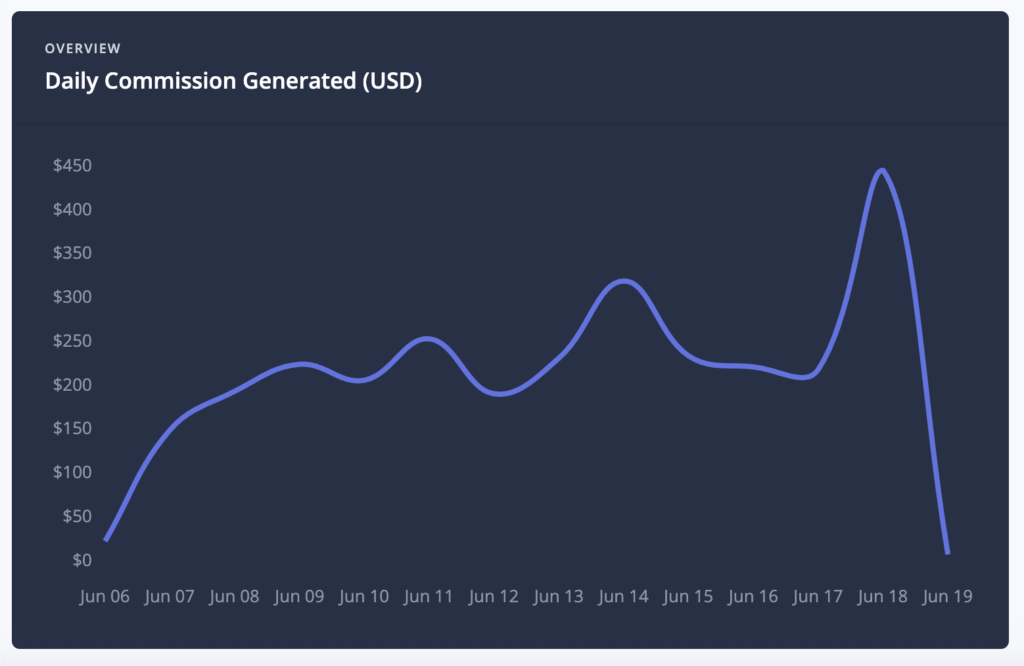
It is also referred to as a line chart and is used to visualize data patterns over time. A line graph represents data points plotted in dots or stars and then connected by a line. The graph usually has the x-axis and y-axis, which is the horizontal and vertical line, respectively.
The x-axis is the independent axis and features the variables that have constant change. On the other hand, the y-axis is dependent on the values of the x-axis. Depending on the use, you can plot several lines on one graph.
Types of Line Graphs
- Simple Line Graph
Only one line is plotted in this type of graph. One axis has the independent variables, while the other has the dependent variables.
- Multiple Line Graph
The graph contains two or more lines that represent more than one variable in a dataset. It is used to study two or more variables over the same period.
- Compound line Graph
It is an extension of the simple line graph used when dealing with different data groups from a large dataset. Each line is shaded downwards to the x-axis. Thus, each group of data represented by a simple line graph is stacked upon one another.
Pros
- It is helpful in the representation of continuous data, such as weight over time.
- Using line graphs, you can extrapolate data for predictions of future trends.
- Allows comparison of trends and identifies the connection or relationships, if any.
- Using the available data, you can estimate the missing data by constructing a line.
- It is usually simple to read, understand and interpret.
Cons
- It’s difficult to determine the exact data at given points in a graph
- Too many lines or lines with similar data plotting points can be challenging to compare.
Combo Graph
A combo chart is a hybrid graph that shows the trend of data through lines and bars. A combo graph shows relationships, especially in data that has differences in scale. For example, if you want to compare revenue, net income, and the percentage profit in the same graph, finding a suitable scale may be a mirage.
However, using a combo graph, you can compare the data using revenue and net income in a bar scale and percentage in a line scale. You will note combo graphs can have two varying scales that represent different items on the same axis. However, having two scales on the same axis is not a must but used when necessary.

Pros
- Enables you to display multiple chart types in a single graph.
- Eases your efforts in finding scale when dealing with data of a wide range.
- A combo graph is easy to plot and interpret the relationship between factors.
Cons
- It only supports one dimension visualization and not two or three.
- It may be more complex than a line graph chart.
Area Chart
Like line charts, area charts find the trend of specific data with time. The area chart is plotted just like the line graph. The only difference is that area charts have a shading below the lines to show the size of the trends.
Below is an example of an area chart.

Types of Area Charts
- Stacked Area Chart
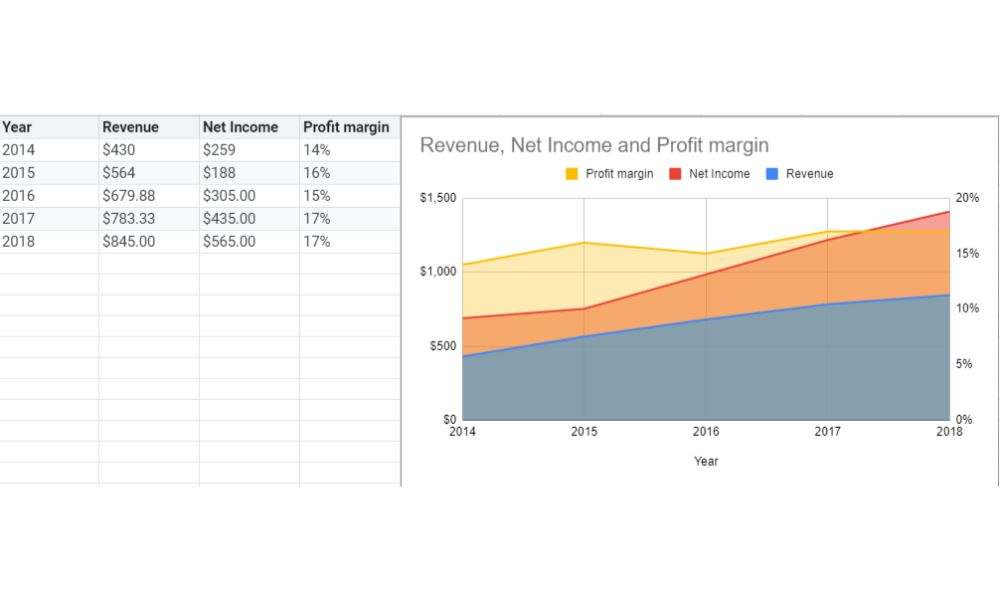
The stacked area chart helps find trends in data by showing a part to the whole relationship. In a stacked area chart, the values of each group display on top of the previous group, which makes it easy to check the pattern of the numeric variables.
For example, to find the trend and the relationship between time, revenue, net income, and the resulting profit of the information below would result in a stacked area that looks like this:
- 100% Stacked Area Chart
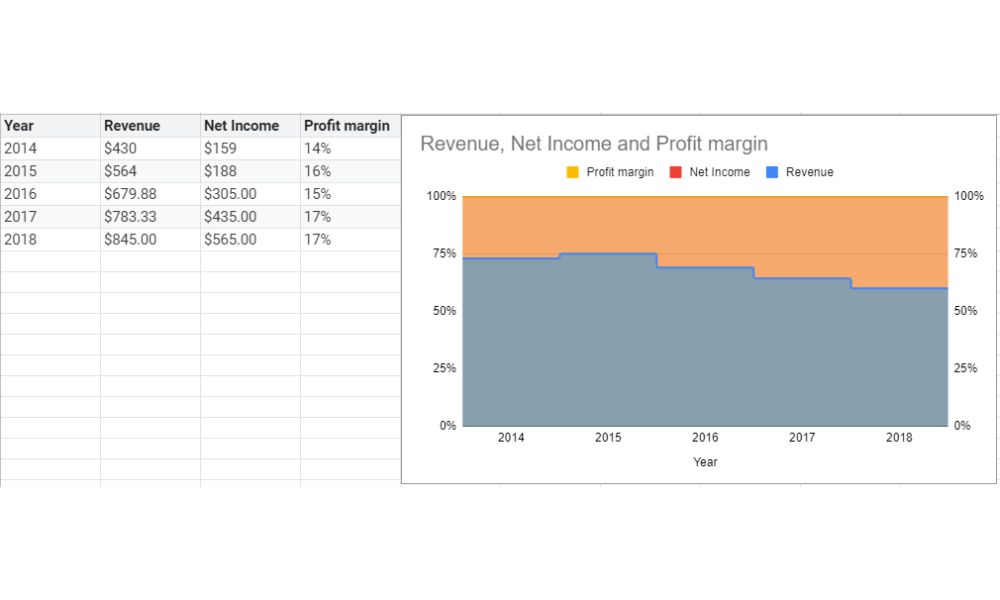
The 100% stacked area chart shows part of the whole relationship over time evolution without paying much attention to the cumulative total. The y-axis is always 100% of the scale, and then the color represents one part of the whole.
Using the same information, here is how the 100% stacked area chart would look.

- Stepped Area Chart
The chart highlights differences and puts a key emphasis on change. The area between the horizontal segments along the x-axis is filled with color to look like a staircase. The stepped area chart highlights the irregularities of change.
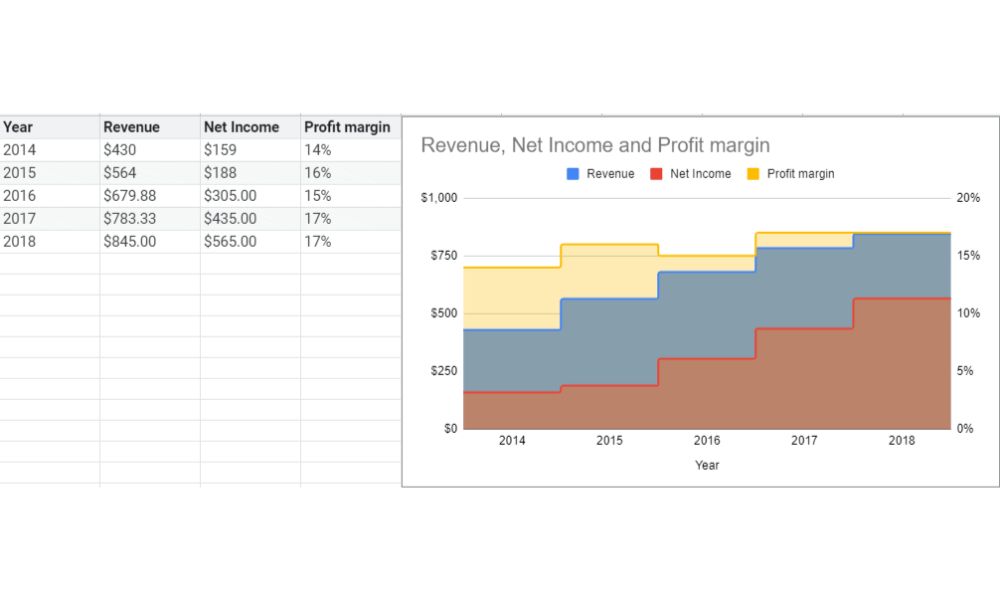
The stepped area chart emphasizes the difference between revenue, net income, and profit margin from the above example.
- 100% Stepped Area Chart
A 100% stepped area chart highlights differences while emphasizing change without being keen on the cumulative total. The stepped area chart is much helpful in showing the changes in data involving irregular intervals.
- 100% Stacked Stepped Area Chart
The stacked stepped areas chart emphasizes the relationship of the part to the whole without keen attention to the cumulative total.

Pros
- It helps show key performance indicators
- Analyzes data in a relatively simple format
- They help spot trends and making comparisons
Cons
- The trends are easily noticeable, but hard to read the values
- It may not be perfect when dealing with a lot of groups.
- Data with the same pattern may overall become complex to analyze.
Column Charts
Column charts help you compare and show connections between different data categories and how they change over time. The data visualization is by using a rectangle with the height being proportional to the plotting values.
Experts commonly refer to the column charts as vertical bar charts. The x-axis is often independent, while the y-axis is dependent.
Below is sample data and the resulting column chart.
Types of Column Charts
- Stacked Column Chart
Stacked column charts show the relationship between a part of the data to the whole of it against time. In a stacked column chart, a column is stacked on top of another to have several vertical columns. Using the same sample, here is the stacked column chart.

In the sample, the net profit is stacked on top of the revenue. From our chart, the interpretation is that the net income increases with the revenue.
- 100% Stacked Column Chart
When the cumulative total is not essential, you can use the 100% stacked column chart to show the relationship and find the trends of a part to a whole with time. The percentage demonstrates the relationship, and the vertical height of all columns is the same. Here is a sample:

Pros
- Displays multiple categories easily
- It is ideal for rates (time-series) analysis.
- They are user-friendly and straightforward to understand.
- It helps you analyze and estimate critical values with a high accuracy level.
Cons
- It increases in complexity as categories or series increase.
- Making an error when estimating result to false interpretation
Bar Chart
A Bar Chart or Bar Graph is a graphical display that notes the difference between the data points in categories. Bars help you determine the relationship between data by comparing their heights. The chart is made of rectangular bars, while the x-axis and the y-axis represent the bars’ length and width. Not that the bars have spaces between each of them.
For example, consider the data below and the graphical outcome:

It is important to note that bars can be vertical or horizontal without changing the meaning of the data.
Types of Bar Charts
- Stacked Bar Chart
The sole purpose of charts is to show or help find the trends of data over time. A stacked bar chart helps you identify the trends and also shows the part of the whole relationship. They are used to show relationships in data of two or more categories. Below is an example.

- 100% Stacked Bar Chart
The 100% stacked bar chart helps you interpret the relationship between the individual items and the whole data in a single bar. This type of chart does not pay keen attention to the cumulative total. Here is the resulting 100% stacked bar chart using the same data.

Pros
- They help you interpret each data category in a frequency distribution
- Summarizes vast data to visually and quickly interpretable segments.
- It makes trends noticeable and easy to highlight.
- It is highly accurate and estimates with a few calculations.
Cons
- You can manipulate it easily to give false interpretations.
- Often requires additional explanation on the axis.
Pie Charts
Pies are everyday meals we make in our homes, and this is the origin of pie charts. Also known as pie graphs, they show data in portions or slices to the whole. Unlike other graphs, pie charts do not have a horizontal axis and a vertical axis. Instead, data representation is through a circle.
Here is an example pie chart comparing a person’s activities through different social media channels.

Types of Pie Charts
Representation of data in a pie chart can be done using the following types of pies.
- Simple Pie Chart
It is the most basic type of pie chart.
- Exploded Pie Chart
In this chart, one of the sectors of the circle is separated from the chart. This is to create emphasis on a particular element in the data set.
A “slice” is taken from the whole original pie and used to create a new smaller pie chart with the exploded pie chart. The idea is to reduce clutter and create emphasis on a particular group of elements.
- Bar of Pie
It is similar to a pie to the pie chart. The difference is that a bar chart is generated in this.
- 3-D Pie Chart
It is a pie chart represented in a three-dimensional space.
- Doughnut Pie Chart
A doughnut chart helps you compare information distribution from parts to a whole. The charts look exactly like the usual doughnut. The example represents a doughnut using the same data as above.

Pros
- Pie Charts are easy and quick to understand.
- It enables data analysis at a glance.
- It works well even for the less informed audience.
Cons
- It is ineffective at representing many data sets.
- Pie charts may not be perfect when using negative data sets.
Scatter Graph
A scatter graph shows you the numeric coordinates along the x-axis(horizontal axis) and y-axis(vertical axis). When involving large amounts of data, you get the patterns and the trends between two variables. This graph expounds on how two or more data sets relate to a category. The example below shows tracks when people are active on social media versus the numbers.
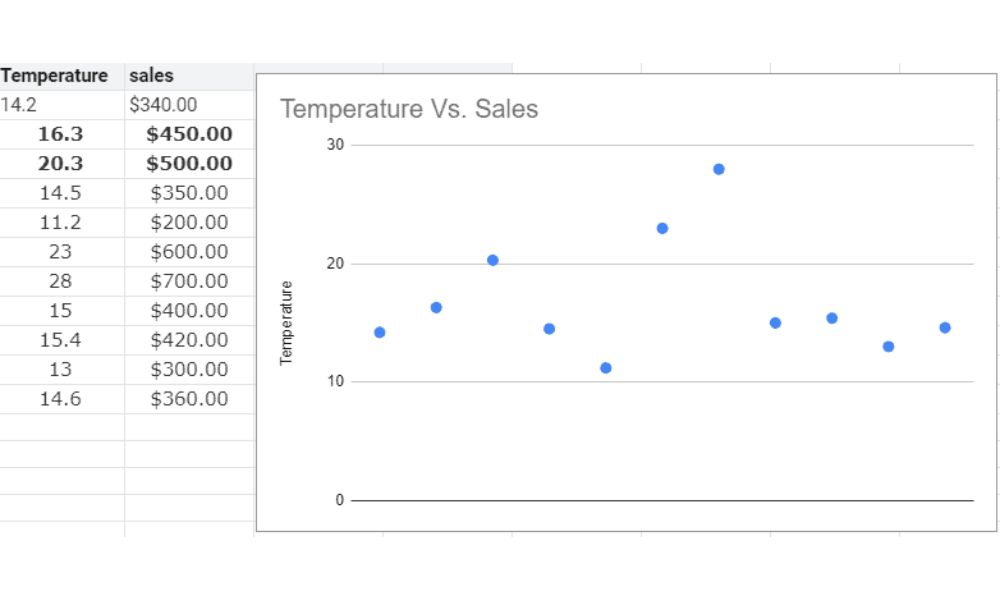
Interpretation of a scatter chart is through data coordinates.
Type of Scatter Graph
- Bubble Charts
Bubble charts are very similar to the scatter chart; the only difference is that they show data in 3 dimensions. It adds the third dimension to scatter, which is the size of the bubble. A bubble chart can only interpret data that has three categories. Below is an example.

Pros
- It features simplicity with no need for mathematical methods.
- The size of an item does not influence the graph.
- It defines the relationship between variables.
- It uses for data extrapolation and interpolation
- It is helpful in non-linear patterns.
Cons
- It is not specific on the degree of relationship, which might be hard to interpret.
- Many data points can make the graph unreadable.
- It is challenging to find exact values.
Histogram
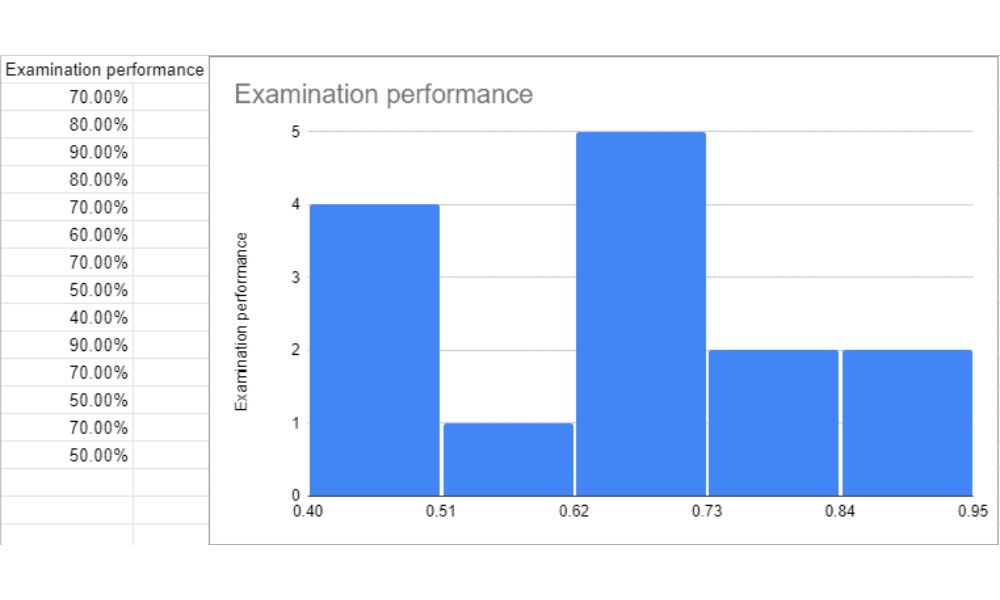
A histogram is a graphical representation of the range in different data sets. The height shows the intensity of values in each range. A histogram representation is similar to a bar chart, but the former groups the values in their range.
You choose the range depending on what you prefer and what works for your scale. Here is an example:
Types of Histogram Charts
Classification of histogram charts depends on their distribution.
- Normal Distribution
This type of histogram is usually bell-shaped. Distribution is normal, and it is the standard representation of how a typical histogram is depicted.
- Bimodal Distribution
In this case, there are two groups of histogram charts with normal distribution. It results from combining two processes in a dataset.
- Skewed Distribution
A histogram chart is either right or left-skewed, depending on the peak’s direction. The skewed distribution is an asymmetrical graph with an off-center pick tending to be in the direction where the peak tends to.
- Random Distribution
This chart is devoid of a regular pattern and has multiple peaks.
- Edge Peak Distribution
The distribution has a structure similar to a normal distribution but has a prominent peak at one edge.
- Comb Distribution
It looks like a comb, and the rectangular bars oscillate between tall and short.
Pros
- It is practical and easy
- They help you organize continuous data.
- Helpful in organizing discrete and unordered data.
- They group numeric data into uniform intervals.
Cons
- It is hard to compare two displays.
- It shows numbers within a range but not the actual values.
Candlestick
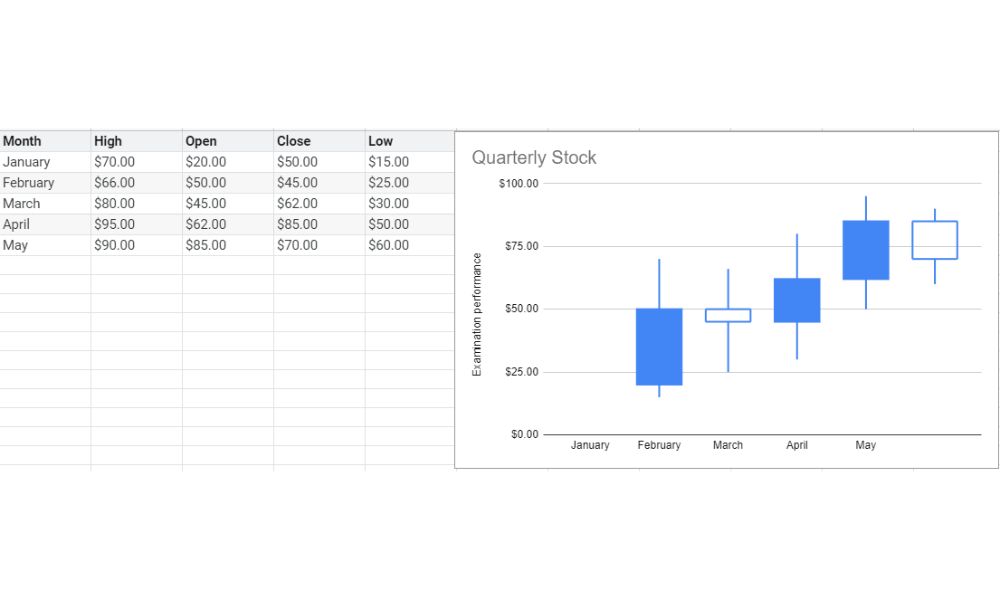
If you have ever participated in forex, candlesticks may not be a new thing to you. Candlestick charts show the low, high, opening, and closing of values for a certain amount of time.
Apart from the stock exchange, they are also used to track scientific data as well as rainfall. Below is the data sample and the candlestick chart outcome.
Forex traders have been using candlestick charts for the wrong time due to their enormous benefit in technical analysis.
Pros
- They are superior to traditional charts in offering information for technical analysis.
- They are usable with any timeframe.
- They offer clarity, simplicity, and ease in describing patterns.
- Candlesticks are infinitely customizable.
Cons
- They offer a lot of information, some of which may be irrelevant.
- They may be tricky to understand to newbies.
Organization Charts
The organizational chart shows the connection of hierarchy between participants in a company, group, or family setup. These charts explain the diagrammatic relationship, the channels of the authority of different entities in an organization. Org charts may be vertical, horizontal, or circular.

Pros
- They show a clear reporting structure in an organization.
- It helps new members capture the hierarchy of power.
- Eases the planning by managing workload between different individuals.
Cons
- Maintaining the organizational chart may be a headache, especially in big organizations.
- Organizational charts kill informal communication, which is a hub for exchanging ideas.
Treemaps Charts
Treemap charts organize objects into parent-to-child hierarchies. The genesis of these charts aimed at visualizing large amounts of data without losing the trail in the connection data.
Treemaps are ideal for use if you want to show the part-to-whole relationships and precise comparisons between categories. They are also mainly used in instances where the data you’re working with is hierarchical.
Treemaps charts use color and size to denote importance and urgency in their data display. Here is an example:

Pros
- They are easy to understand and analyze.
- Treemaps Charts are practical for use with large sets of data.
- They are perfect in pointing out the similarities and anomalies in data.
- Maps and charts allow you to show importance and urgency using size and color, respectively.
Cons
- It is deficient in handling data that varies in magnitude
- It does not display negative data variables.
- Treemaps charts are unsuitable for print, especially those involving large amounts of data.
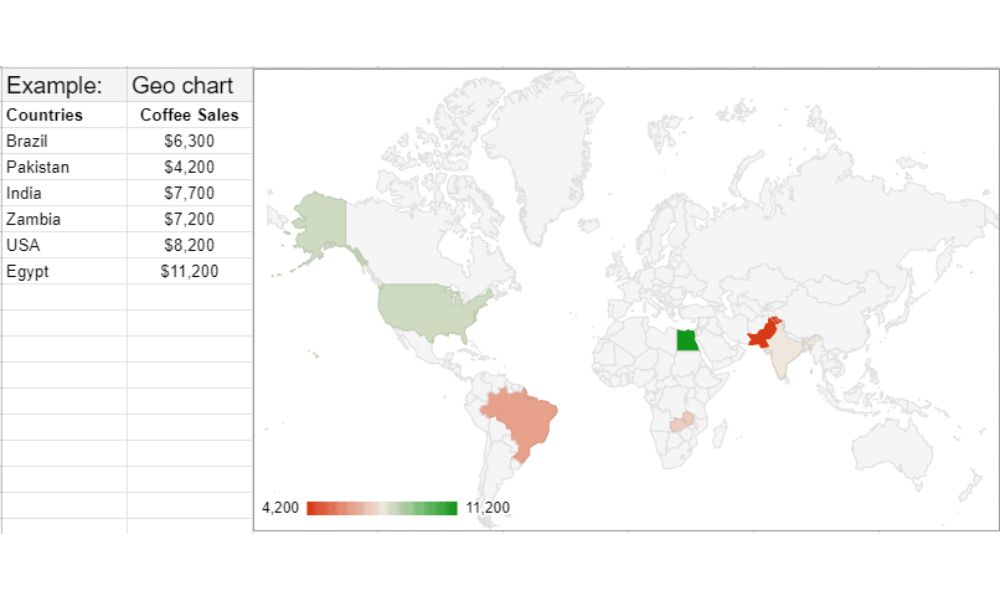
Geo Chart
Geo chart shows the maps of a country, region, or continent with its respective values colored. Businesses use this chart to show their sales and company performance in different regions. The intensity of the color determines value. Check from the example below.
Pros
- They require less artistic skills to reproduce as maps are predetermined.
- It is easy to make changes and understand.
- They feature easier data symbolization.
Cons
- Shapes distort when drawn.
- It may be a pain in the back if you don’t understand maps.
Waterfall Graph
Waterfall graphs show the relationship between values, whether they are adding or subtracting from the initial value. The chart is also known as the flying brick chart or Mario chart because of how the columns hang. The graphs primarily help conduct analysis when explaining the transition of a value quantitatively, either by increment or decrement. Most organizations use the waterfall charts to showcase revenue changes and their effect on profit.

Pros
- They are simple to create
- Waterfall graphs are easy to follow on the visual display of positive and negative changes.
- It doesn’t need any special data preparation.
Cons
- It is easy to manipulate, which can affect the overall outcome
- It’s not easy to make prediction and estimations
Radar Chart
Radar charts help users analyze the different choices depending on data sets. This chart is also known as spider chart and web chart, among other names. Radar charts explain the relationship between the different variables in a 2-D graph with one radial line for each data set.
The length of a radial line is proportional to the size of the varying data set. The radar chart is most helpful in displaying multivariate observations. Below is an example:

Pros
- It helps you find the connection in a vast list of variables.
- It enables you to notice the outliers quickly.
- You can manipulate the different scales of measurements.
- It helps you easily and quickly compare data sets.
- Using color, you can differentiate between different entities.
Cons
- The radar charts get overcrowded if a lot of variables are involved.
- They are not perfect in comparing vastly distinctive variables.
- The information depends on your accuracy in judging radial distance.
Gauges Charts
Gauges Charts show the numeric values or measurements within a specific range. The value on each pointer reads against the colored data range. The chart is the most used to show key business indicators and comparing values between several variables using multiple pointers.
In the example below, the gauge chart compares the profits from three different products.

Pros
- The graphs are straightforward.
- The color mix grabs the reader’s attention.
- The Gauges are easy to manipulate
- Gauge charts eliminate chances of parallax errors
Cons
- Occupy a lot of space while showing a lesser detailed chart.
- They omit key information
- A single gauge can only show one variable
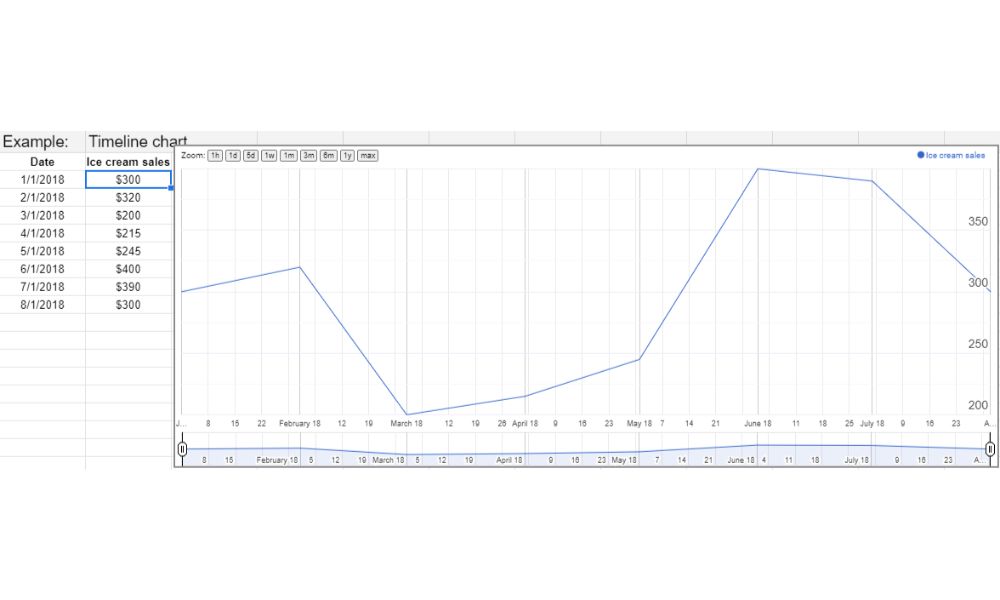
Timeline Charts
Timeline charts help users mark actual events in chronological order. They help mark occurrences over time, whether in the past, present, or planning to happen. In the modern world, they are mainly used to mark timelines for different business projects. They are perfect in bringing the process or a series of events into an actionable idea.
In the example below, the timeline chart shows marketing expenses in a particular business for one year.
Pros
- It makes timelines easy to read and understand
- Help stay organized in a business setup.
- It helps set reasonable time frames on the entire project
- It makes complex achievements effortless.
Cons
- Requires consistency and tracking, which can be tedious.
- The graph may take time to craft as it is detailed.
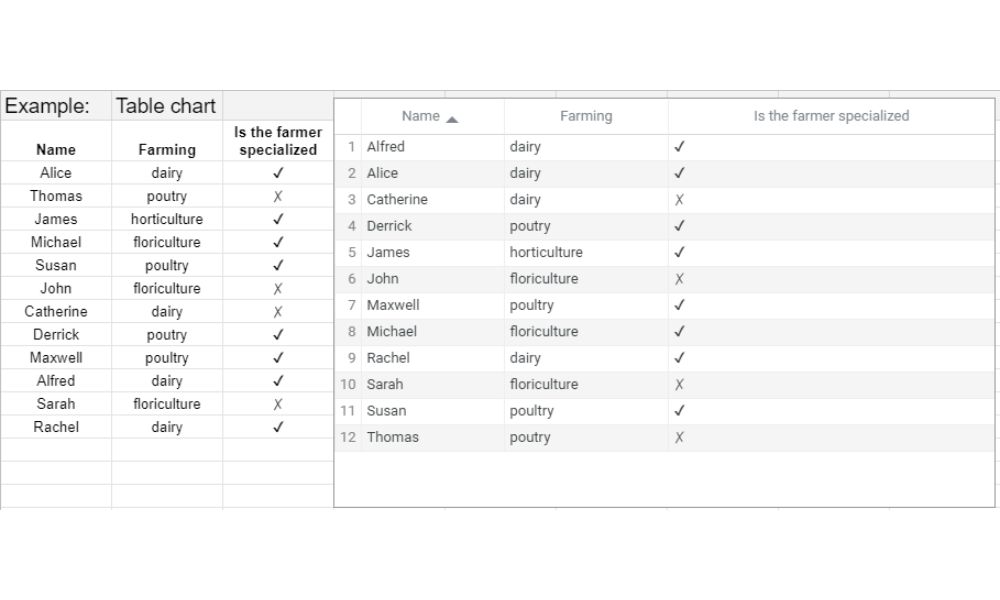
Table Charts
Table charts help you turn a spreadsheet table into a chart that you can sort and store. Table charts arrange data into rows and columns for easy data analysis. If you’re a customary user of the spreadsheet, then you have certainly come across table charts.
Pros
- It is easy to follow and organize.
- It helps you compare a large number of data sets.
- Table charts make comparisons fast and quick.
Cons
- The trend is not easily noticeable.
- You can only organize data alphabetically.
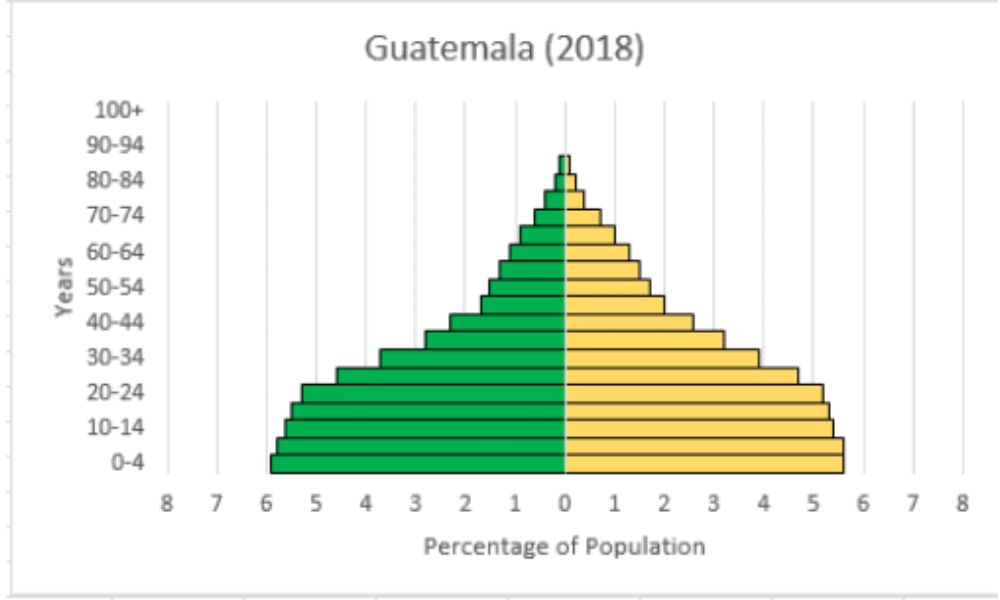
Population Pyramids
Population pyramids help visualize the representation of age and gender. The graph is a population pyramid because it takes the shape of a pyramid. It shows if the population is healthy and growing.
The population base starts with the young occupying the more significant segment at the bottom, and it reduces as age increases.
Pros
- They show the composition of a population in gender and age
- It is easy to skim through and make a conclusion
- It features factors affecting an area.
Cons
- Only shows the population structure.
- The bars only feature age, and therefore some detail is lost.
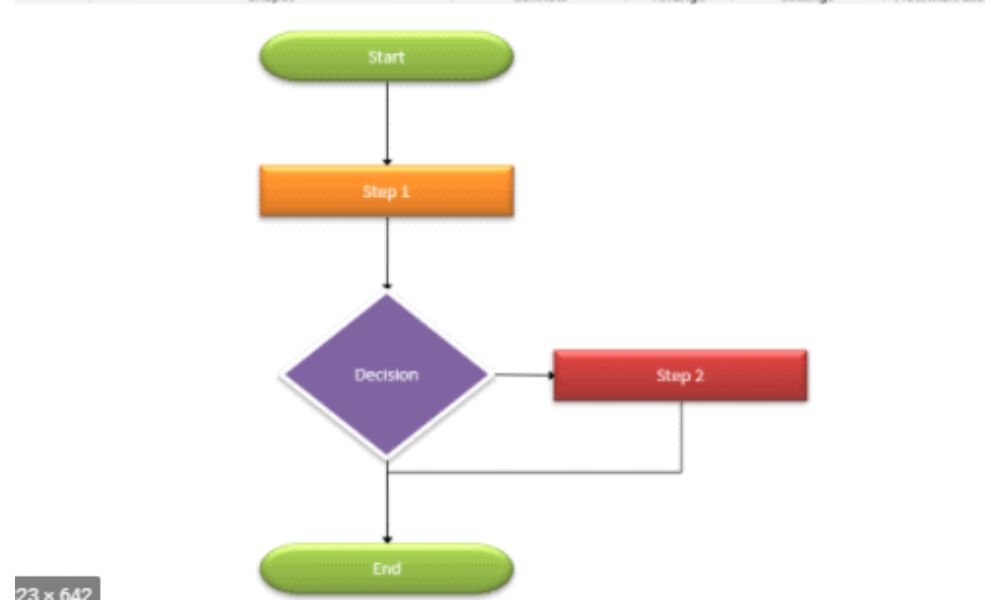
Flow Charts
A flow chart helps you process a sequence step by step to help you analyze, design and document. Flow charts can be simple and complex, depending on the project involved. A flow chart can have one opening or multiple.
Pros
- Flow charts help you communicate the logic of a system.
- They help analyze the issue at hand effectively.
- They are easy to understand and follow.
- Flow charts are perfect when doing documentation.
Cons
- It can get complex if it involves a long process.
- If modifications are needed, you’ll have to refigure the flow chart.
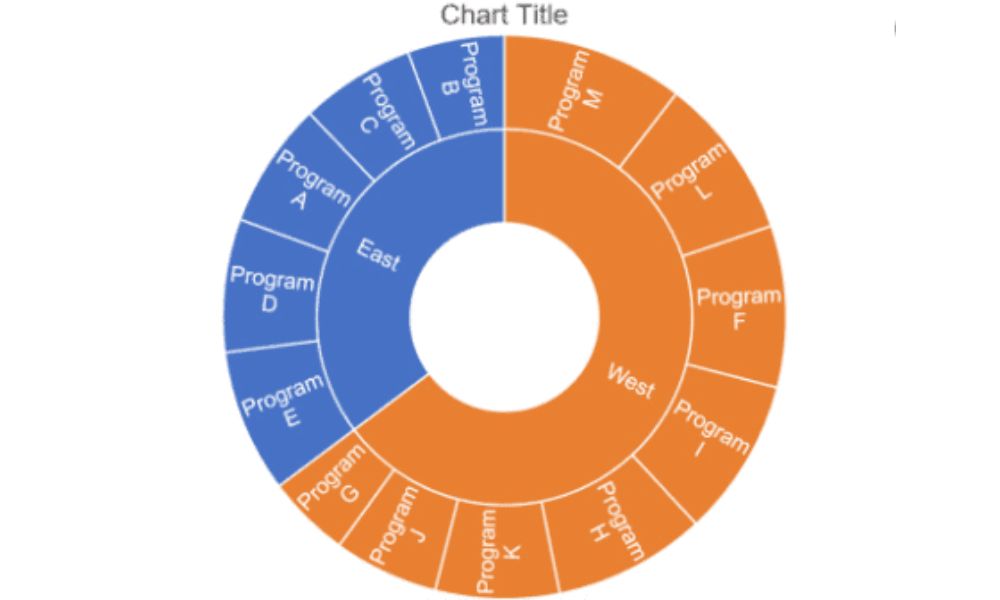
Sunburst Charts
The sunburst chart is a multi-level pie chart that illustrates hierarchical data using circles. Every ring in the sunburst chart represents a different level of hierarchy. The more a project has many levels of hierarchy, the more complex the sunburst gets.
Pros
- The circular orientation utilizes space more effectively than other hierarchical visualization.
- Its resemblance to a pie chart makes it super intuitive.
- It is easy to interpret with the same level elements regarded as equal.
Cons
- Interpreting angular reading is complicated to the human eye
- The radial structure gets complicated fast.
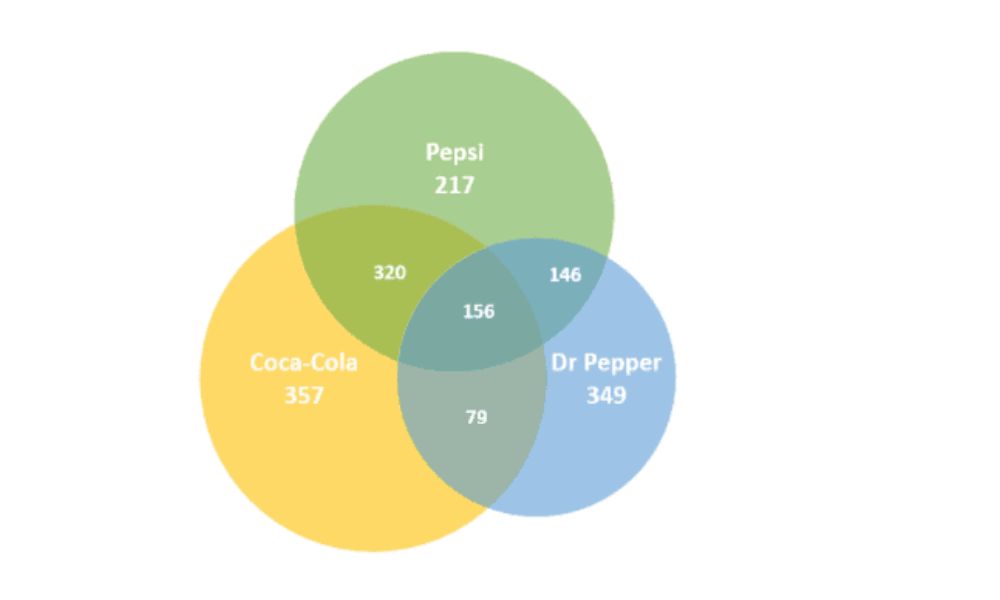
Venn Diagrams
Venn diagrams show mathematical or logical sets using circles that enclose common elements. The common elements in the sets are areas that overlap within the different circles.
The Venn diagrams help you show relationships between two or three sets of data. They help you note differences and categorize similarities together using overlapping circles.
Pros
- It is ideal for visual learners.
- It is a quick way to interpret a complicated issue.
- Venn diagrams work well when there are overlapping issues
- The diagram is perfect for use with mathematical issues
Cons
- Difficult to use with new ideas that have no similarity.
- It requires a high knowledge base.
- Venn diagrams are limited to comparison and contrast.
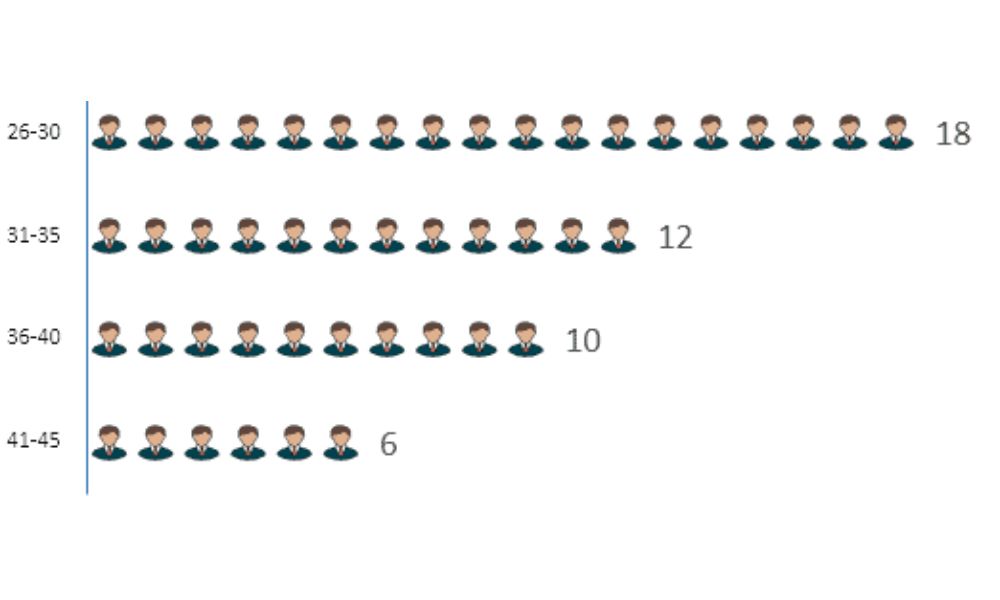
Pictograms
These are graphs that use images and symbols to illustrate data. For example, to illustrate a day with fair weather, you could use a sun image and rain clouds to symbolize a stormy day.
Pictographs are visually appealing, and since the images can occupy a lot of space, there is a scale. For example, one graphical image of a person can represent one thousand people.
Pros
- They are appealing and easy to read.
- With a comfortable scale, pictograms can handle a large set of data.
- It clarifies messages with minimal detail.
Cons
- It’s challenging when handling a large set of data that has no standard scale.
- It can be confusing if you group a lot of pictograms.
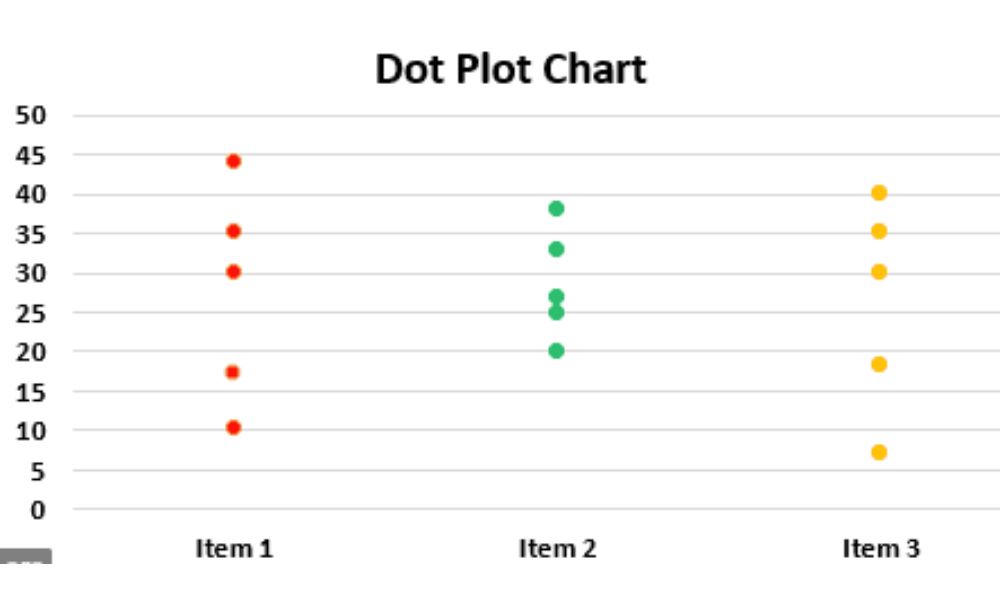
Dot Graph or Plot
A dot plot is a simple form of data visualization technique that shows data points as dots. The dots primarily represent grouped data or categories. This type of graph is similar to a histogram in that it shows the distribution of data sets.
Uses
- Used to show the distribution of simple and small data.
- To show the range and shape of grouped data.
Pros
- It is simple and easy to make
- The graph conserves numerical information
- It displays the clusters, gaps, and outliers.
Cons
- It can be time-consuming with large data sets.
- It is hard to display fractions.
Spline Chart
A spline chart is a line chart with data points connected smoothly. The spline graph is used to emphasize the trends in the data distribution on a specific timeframe. It features the x-axis and the y-axis, with the x-axis primarily representing time.
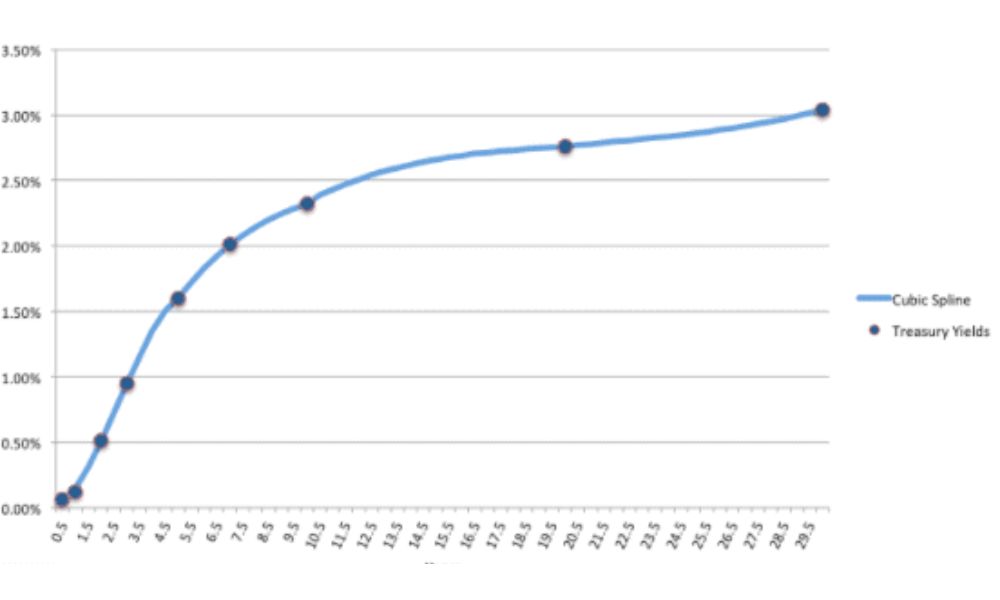
Uses
- It identifies the trend of data within a particular time.
- The graph is used in interpreting numerical data.
Pros
- It is easy to follow and visualize
- It can compare multiple data sets over time.
- The chart can help compare large data sets with minimal hassles.
Cons
- It is inadequate when comparing close data sets.
- The chart leaves some details like the mean.
Bullet Chart
Stephen Few developed bullet charts or graphs to help track performance against target visually. The chart compares performance versus target and then displays the resulting comparison in a single column. The chart resembles a thermometer and displays color-coded columns.
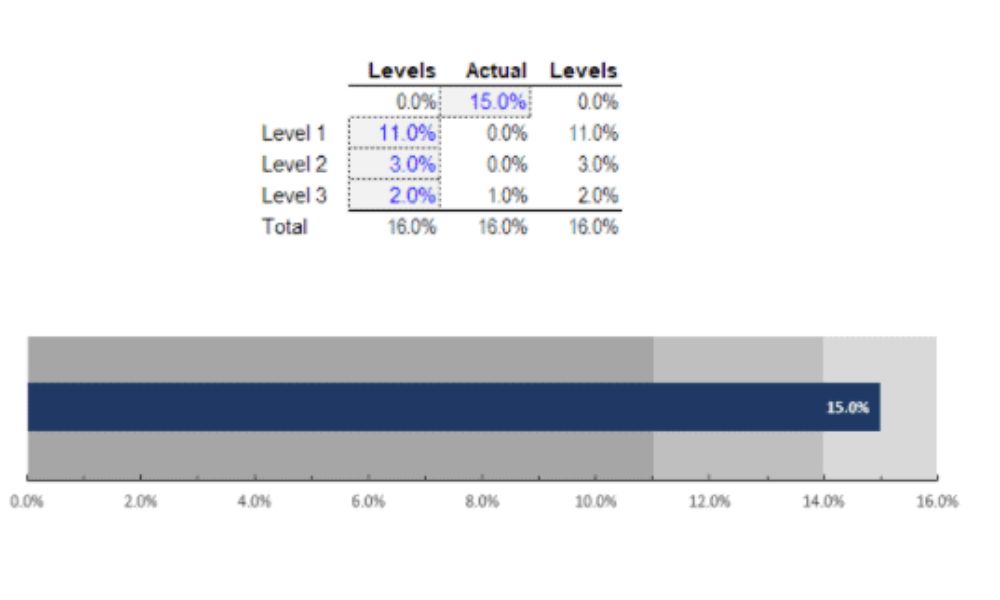
Uses
- Tracking performance against the target in a business.
- It is used as an alternative to gauge charts.
Pros
- It helps save space by orienting the columns either horizontally or vertically.
- It is easy to read and informative.
- The chart can display multiple detailed columns.
Cons
- Offering too much information in a single chart can be confusing
- Having many shades of one color can be distracting.
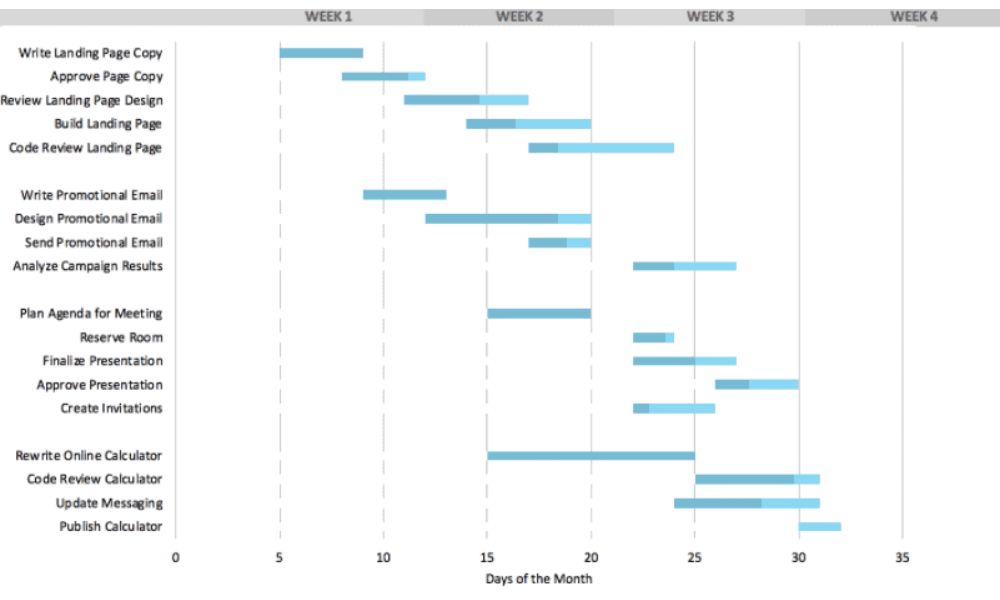
Gantt Chart
Gantts charts are specialized bar graphs that use bars of different lengths and color-coded. Henry Gantt invented the chart in the 18th century. On the vertical axis, the charts list the tasks, while the horizontal axis shows the timeframe of each activity. Thus, the chart illustrates when the projects start and the finish date.
Types of Gantt Charts
- Progress Gantt charts
In this Gantt chart, the shading determines the degree of completion, i.e., a project that is 60% complete is shaded up to 60% starting from the left side of the bar.
- Linked Gantt charts
The chart has lines that show the dependencies between different tasks. The lines communicate the relationship between tasks simply in simple cases but become a little complex in many cases.
Uses
- Showing the duration of an activity in a project
- Recording the relationship between activities (dependency)
- It helps you determine the resources needed in a project
Pros
- It helps you organize your thoughts
- Enables you to create realistic timeframes
- Eases a complex project by creating a picture.
- You can create a large version for visibility.
Cons
- With large tasks, they can be overly complex.
- The size of the bar does not translate to the amount of work done
Funnel Chart
The funnel chart shows the flow of users in a business process. The chart has its name from the shape it depicts, i.e., a broad head and a narrow end. The number of users at the head is 100%, and the percentage decreases as the process ends. This chart does not have a labeled organized, horizontal, and vertical axis.
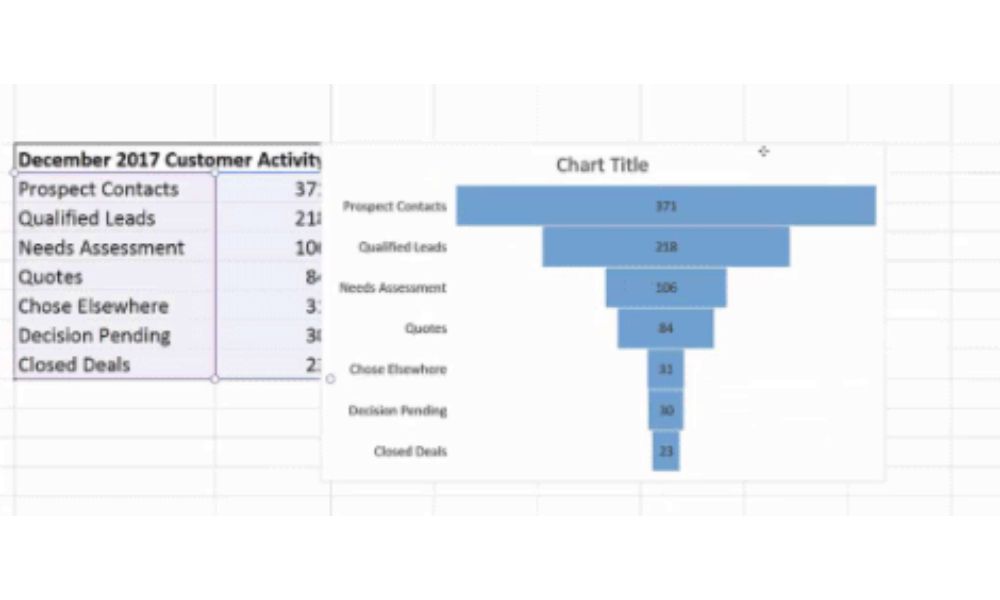
Uses
- Tracking the flow of users in a business.
- visualizing the number of users in a stage
- Identifying weak stages within a process.
Pros
- ·It helps you identify the trends in three or more stages.
- It’s easy to visualize the stages that need reworking.
- It is easy to work with, even on complex processes.
Cons
- It only works with a process with three or more processes.
- The chart leaves out a lot of details.
Box and Whisker Chart
A box and whisker plot (or box plot) help you visualize data distribution through its mean and quartiles. The box has a vertical extension of lines called whiskers that show the variability on the lower and upper quartiles. What more, the chart shows symmetry, skewness of data, and detect outliers. The box plot is also ideal in exploratory data analysis.
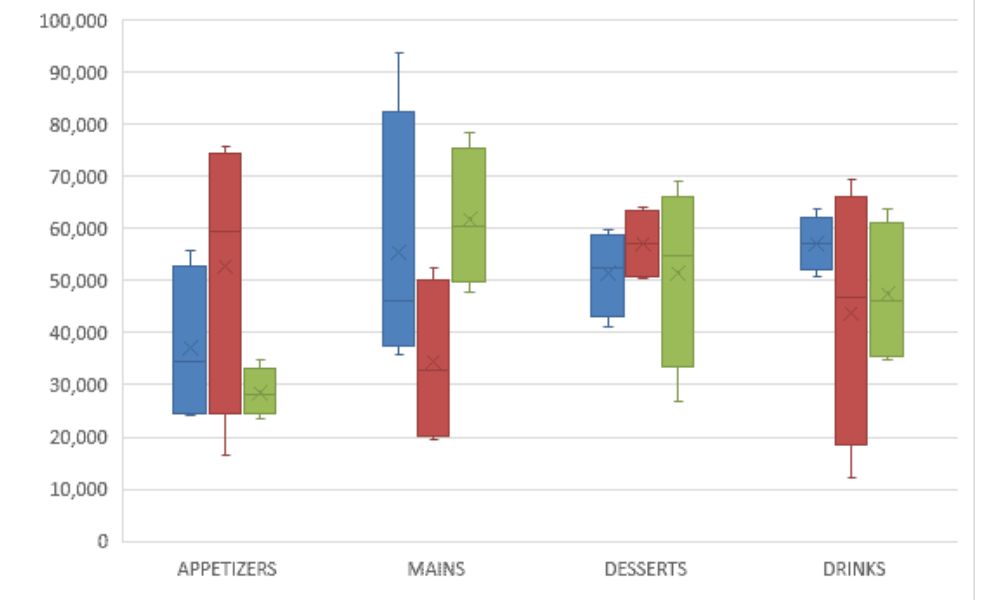
Uses
- Mathematicians use it in statistical analysis.
- The chart shows the shape of data distribution, the central value, and its variability.
Pros
- Helps users handle extensive data easily.
- The chart shows a summary of the distribution of results.
- Helps you easily identify the outliers in a data distribution.
Cons
- Box and whisker chart does not show the individual values
- The box plot can be skewed.
Conclusion
There is a wide variety of charts and graphs used in different scenarios to visualize data. The situation of graphical application depends on the strengths and weaknesses each method offers. It is also paramount to put the audience that will use the graphs and charts into consideration.
Some of the graphs and charts covered in this article are used in scientific scenarios, others in marketing, while others fit in mathematical calculations. Thus, the data analyst chooses one that best suits them.

Jon Dykstra is a six figure niche site creator with 10+ years of experience. His willingness to openly share his wins and losses in the email newsletter he publishes has made him a go-to source of guidance and motivation for many. His popular “Niche site profits” course has helped thousands follow his footsteps in creating simple niche sites that earn big.